
Hoja informativa sobre la hipertensión arterial
Fuente: Sistema de Vigilancia de Factores de Riesgo del Comportamiento, CDC.
Datos sobre la hipertensión arterial
- Tener la presión arterial alta (hipertensión) le pone a usted en riesgo de enfermedades cardiacas y accidentes cerebrovasculares, que son causas principales de muerte en los Estados Unidos.1
- La hipertensión arterial fue la causa principal o un factor que contribuyó a la muerte de 360,000 estadounidenses en el 2013, lo que equivale a casi1,000 muertes diarias.2
- 75 millones de adultos (32%) estadounidenses tienen hipertensión arterial, es decir, 1 de cada 3.3
- 36 millones de adultos estadounidenses con presión arterial alta no la tienen bajo control.4
- Alrededor del 30 por ciento de los adultos estadounidenses tiene prehipertensión (su presión arterial es más alta de lo normal, pero no alcanza el margen de hipertensión arterial).2 Tener prehipertensión eleva el riesgo de hipertensión arterial.
- La hipertensión arterial por lo general no presenta signos o síntomas de alerta, por lo que muchas personas no saben que la padecen.
- Reducir el consumo promedio de sodio en la población de 3,300 a 2,300 mg al día puede ahorrar 18,000 millones de dólares gastados en atención médica y reducir los casos de hipertensión arterial en 11 millones anualmente.5
- La presión arterial alta le cuesta al país casi 48.6 millones de dólares anualmente en gastos médicos directos y 3,600 millones de dólares en pérdida de productividad.6
La presión arterial se registra con dos cifras. La primera (sistólica) representa la presión de sus vasos sanguíneos cuando su corazón late. La segunda (diastólica) representa la presión de sus vasos sanguíneos cuando el corazón reposa entre latidos.
Niveles de la presión arterial7 | |
|---|---|
Normal | sistólica: menos de 120 mmHg diastólica: menos de 80mmHg |
En riesgo (prehipertensión) | sistólica: 120–139 mmHg diastólica: 80–89 mmHg |
Alta | sistólica: 140 mmHg o más alta diastólica: 90 mmHg o más alta |
Esfuerzos de salud pública de los CDC
- Million Hearts®
- Programa Nacional de Prevención de Enfermedades Cardiacas y Accidentes Cerebrovasculares de los CDC
- WISEWOMAN
Más información (en inglés y español)
Para obtener más información sobre la hipertensión arterial, visite los siguientes sitios web:
- Centros para el Control y la Prevención de Enfermedades
- Asociación Americana del Corazón
- Instituto Nacional del Corazón, el Pulmón y la Sangre
Referencias
- Kochanek KD, Xu JQ, Murphy SL, Miniño AM, Kung HC. Deaths: final data for 2009. National vital statistics reports. 2011;60(3).
- Roger VL, Go AS, Lloyd-Jones DM, Benjamin EJ, Berry JD, Borden WB, et al. Heart disease and stroke statistics—2012 update: a report from the American Heart Association. Circulation. 2012;125(1):e2–220.
- CDC. Vital signs: prevalence, treatment, and control of hypertension. United States, 1999-2002 and 2005-2008. MMWR 2011;60(4):103–8.
- CDC. Informe de Vital Signs: Awareness and Treatment of Uncontrolled Hypertension Among Adults—United States, 2003–2010. MMWR2012;61(35);703-709.
- Palar K, Sturm R. Potential societal savings from reduced sodium consumption in the U.S. adult population. American Journal of Health Promotion. 2009;24(1):49–57.
- Heidenriech PA, Trogdon JG, Khavjou OA, Butler J, Dracup K, Ezekowitz MD, et al. Forecasting the future of cardiovascular disease in the United States: a policy statement from the American Heart Association. Circulation. 2011;123(8):933–44.
- Chobanian AV, Bakris GL, Black HR, Cushman WC, Green LA, Izzo JL Jr, et al. Seventh report of the Joint National Committee on Prevention, Detection, Evaluation, and Treatment of High Blood Pressure. Hypertension. 2003;42(6):1206–52.
High Blood Pressure Fact Sheet|Data & Statistics|DHDSP|CDC

- About 70% of US adults aged 65 or older have high blood pressure, but only about half have it under control.
- Despite having Medicare Part D prescription drug insurance, at least 25% of adults aged 65 or older are not taking their blood pressure medications as directed—according to the latest Vital Signs report.
- Health departments can use and share important tools and protocols to advance blood pressure medication adherence.
High Blood Pressure Fact Sheet

Blood pressure is the force of blood pushing against the walls of the arteries that carry blood from your heart to other parts of your body. Blood pressure normally rises and falls throughout the day, but it can damage your heart and cause health problems if it stays high for a long time. High blood pressure is also called hypertension.
High Blood Pressure in the United States
- Having high blood pressure puts you at risk for heart disease and stroke, which are leading causes of death in the United States.1
- About 75 million American adults (32%) have high blood pressure—that’s 1 in every 3 adults.3
- About 1 in 3 American adults has prehypertension—blood pressure numbers that are higher than normal—but not yet in the high blood pressure range.3
- Only about half (54%) of people with high blood pressure have their condition under control.2
- High blood pressure was a primary or contributing cause of death for more than 410,000 Americans in 2014—that's more than 1,100 deaths each day.1
- High blood pressure costs the nation $48.6 billion each year. This total includes the cost of health care services, medications to treat high blood pressure, and missed days of work.1
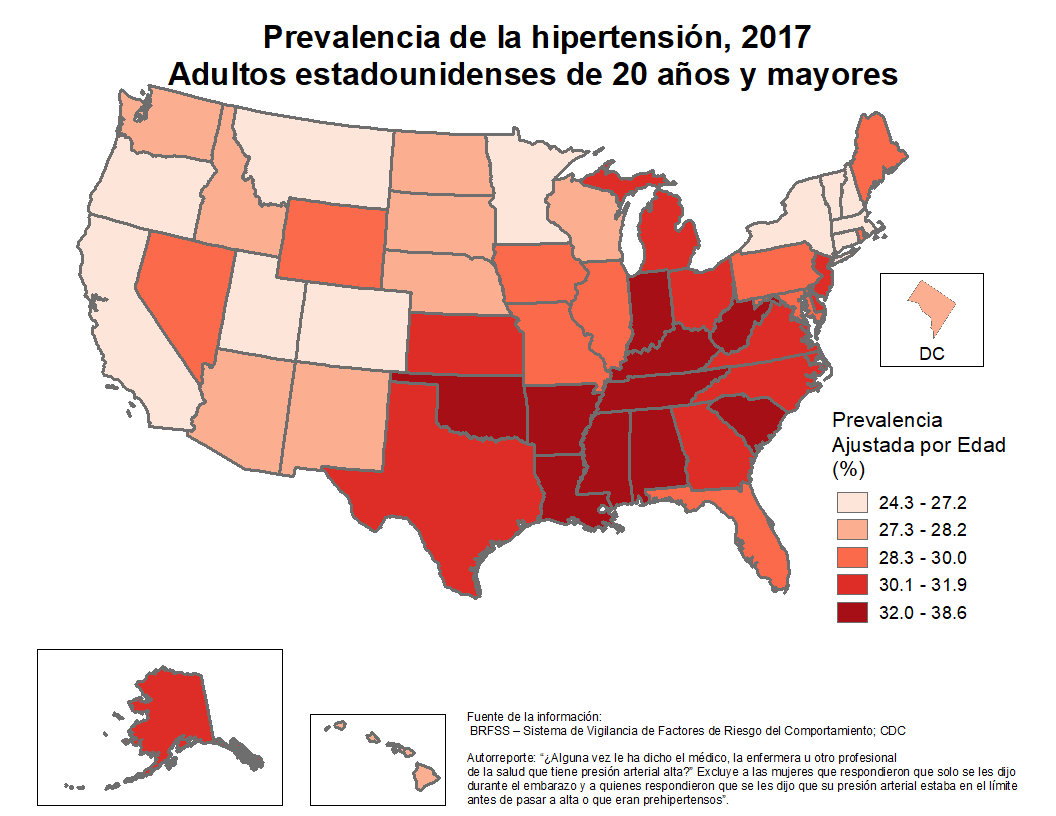
Rates of High Blood Pressure Vary by Geography
High blood pressure is more common in some areas of the United States than in others. Below is a map showing the self-reported rate of hypertension by state in 2011. However, this likely underreports the true effect of hypertension in each state. About 1 in 5 adults is unaware of having high blood pressure and would not report having it.2

Risk Factors for High Blood Pressure
Having certain medical conditions can increase your chances of developing high blood pressure. These conditions include
Unhealthy behaviors can also increase your risk for high blood pressure, especially for people who have one of the medical conditions listed above. Unhealthy behaviors include
- Smoking tobacco.
- Eating foods high in sodium and low in potassium.
- Not getting enough physical activity.
- Being obese.
- Drinking too much alcohol.
Signs and Symptoms of High Blood Pressure

High blood pressure usually has no warning signs or symptoms, so many people don't realize they have it. There's only one way to know whether you have high blood pressure: Have a doctor or other health professional measure it. Measuring your blood pressure is quick and painless.
What Blood Pressure Numbers Mean
Blood pressure is measured using two numbers. The first number, called systolic blood pressure, represents the pressure in your blood vessels when your heart beats. The second number, calleddiastolic blood pressure, represents the pressure in your blood vessels when your heart rests between beats. Blood pressure is measured in millimeters of mercury (mmHg).
The chart below shows normal, at-risk, and high blood pressure levels. A blood pressure less than 120/80 mmHg is normal. A blood pressure of 140/90 mmHg or more is too high. People with levels from 120/80 mmHg to 139/89 mmHg have a condition called prehypertension, which means they are at high risk for high blood pressure.
Blood Pressure Levels | |
|---|---|
Normal | systolic: less than 120 mmHg diastolic: less than 80mmHg |
At risk (prehypertension) | systolic: 120–139 mmHg diastolic: 80–89 mmHg |
High | systolic: 140 mmHg or higher diastolic: 90 mmHg or higher |
Controlling High Blood Pressure
Keeping your blood pressure levels in a healthy range usually involves taking medications, reducing sodium in the diet, getting daily physical activity, andquitting smoking.
CDC's Public Health Efforts Related to High Blood Pressure
Web Sites with More Information About High Blood Pressure
For more information about high blood pressure, visit the following Web sites:
References
- Centers for Disease Control and Prevention, National Center for Health Statistics. Underlying Cause of Death 1999-2013 on CDC WONDER Online Database, released 2015. Data are from the Multiple Cause of Death Files, 1999-2013, as compiled from data provided by the 57 vital statistics jurisdictions through the Vital Statistics Cooperative Program: http://wonder.cdc.gov/ucd-icd10.html. Accessed on Feb 3, 2015.
- Farley TA, Dalal MA, Mostashari F, Frieden TR. Deaths preventable in the U.S. by improvements in the use of clinical preventive services. Am J Prev Med. 2010;38(6):600–9.
- Nwankwo T, Yoon SS, Burt V, Gu Q. Hypertension among adults in the US: National Health and Nutrition Examination Survey, 2011-2012. NCHS Data Brief, No. 133. Hyattsville, MD: National Center for Health Statistics, Centers for Disease Control and Prevention, US Dept of Health and Human Services; 2013.


No hay comentarios:
Publicar un comentario