Simple Steps for Using Tissue Atlas on the Human Protein Atlas
The Tissue Atlas forms a part of the Human Protein Atlas database, developed as a tissue-based map of the whole human proteome based on RNA-seq data and antibody-based profiling. In this, you can find protein expression data such as IHC stainings from 44 normal tissues formed using antibodies against the human proteome. You can also compare protein expression to RNA expression. If you find antibodies on the Human Protein Atlas you would like to use, the antibodies produced for the atlas are available from Atlas Antibodies as Triple A Polyclonals.
Atlas Antibodies has created a guide on how to explore the Tissue Atlas. Through the guide, the company shows how to find in which tissues the human proteins occur, and how to investigate antibody stainings from normal as well as cancer tissues. All images appearing in this article are example images taken from the Human Protein Atlas portal.
Guide: Explore the Tissue Atlas for a Specific Protein
In this guide, Aquaporin 4, coded by the gene AQP4, is used as an example. Atlas Antibodies will provide all the data available in the Tissue Atlas for the Aquaporin 4 protein and the antibody stainings using Aquaporin 4 antibodies. You can follow the same steps for the protein they are interested in.
1. Find the Required Protein
Begin by searching for the required protein or gene on the Human Protein Atlas start page.
Figure 1. Search for your gene or protein, image from the Human Protein Atlas portal.
When the protein is found, click on the Tissue Atlas tab found near the upper right corner. In the top of this page, general information about the target gene can be found. See the example below for Aquaporin 4. The page also displays Human Protein Atlas data based on antibody stainings and RNA-seq values.
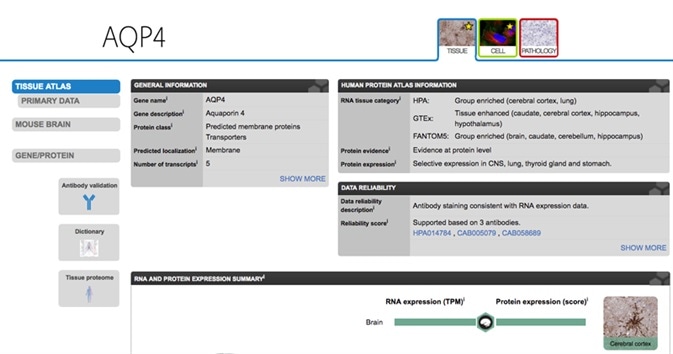
Figure 2. Aquaporin 4 page on the Tissue Atlas, image from the Human Protein Atlas portal.
2. View the RNA and Protein Expression Summary
This section displays the RNA expression (left) and protein expression (right) of AQP4 illustrated as horizontal bars. The 44 normal human tissues studied are separated into color-coded groups based on functional characteristics. For each group, a list of included tissues is accessed by clicking either on the symbol, the text, or on the bars.
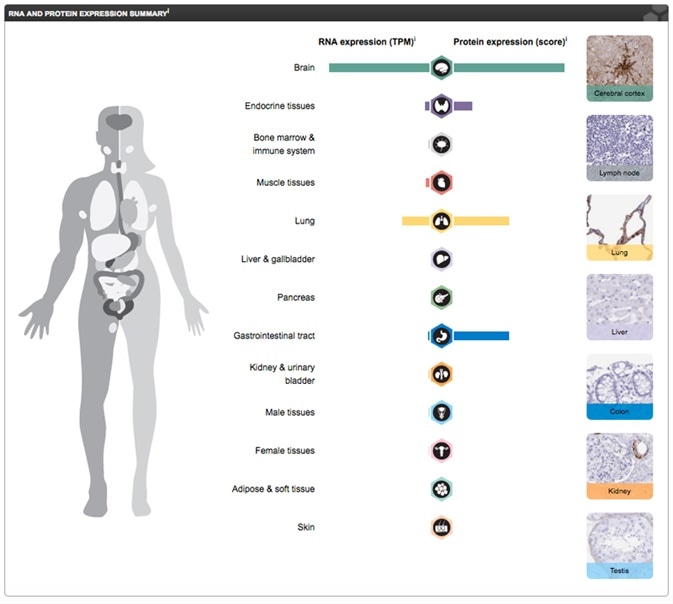
Figure 3. RNA and Protein Expression Summary for Aquaporin 4, on the Tissue Atlas, image from the Human Protein Atlas portal.
To obtain access to all the images for a particular tissue, click on the bar or on the tissue name (shown in green below). The image data page for that specific tissue appears.
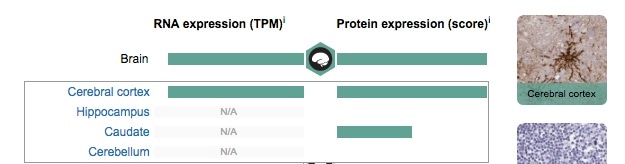
Figure 4. Aquaporin 4 page on the Tissue Atlas, closeup of the protein expression information available for brain tissue. Image from the Human Protein Atlas portal.
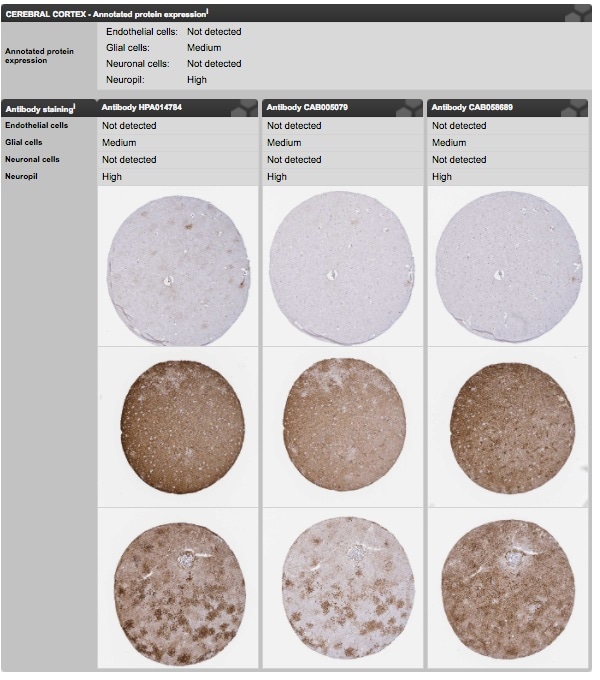
Figure 5. Aquaporin 4 cerebral cortex page on the Tissue Atlas. Image from the Human Protein Atlas portal.
3. Explore the Image Data Page—Cerebral Cortex Example
When going to a particular tissue page, antibody stainings are displayed from tissue samples from three different patients. The Aquaporin 4 cerebral cortex page is selected here as an example. The entire core images can be seen in high-resolution when the images are clicked. The image below exhibits one of the cerebral cortex stainings for Aquaporin 4 in high resolution. Information regarding the samples is illustrated in the table to the left.
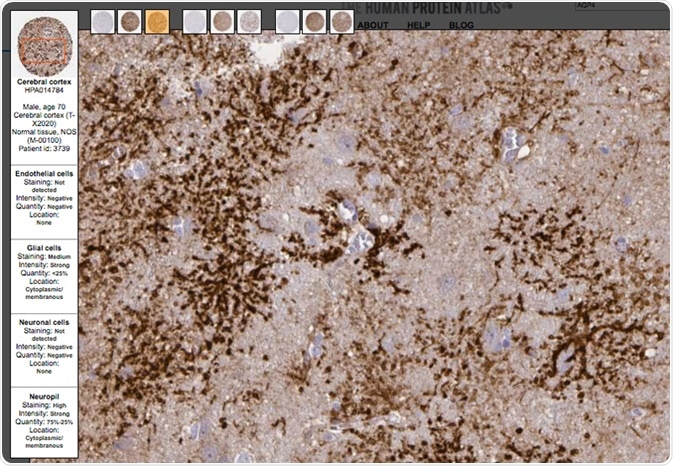
Figure 6. Closeup of an example staining on the Aquaporin 4 cerebral cortex page on the Tissue Atlas. Image from the Human Protein Atlas portal.
RNA-seq data of the separate samples that have been used for the transcript profiling are illustrated in the lower section of this page. Transcripts per million (TPM) values offer a quantification of the gene abundance which is comparable between various genes and samples.
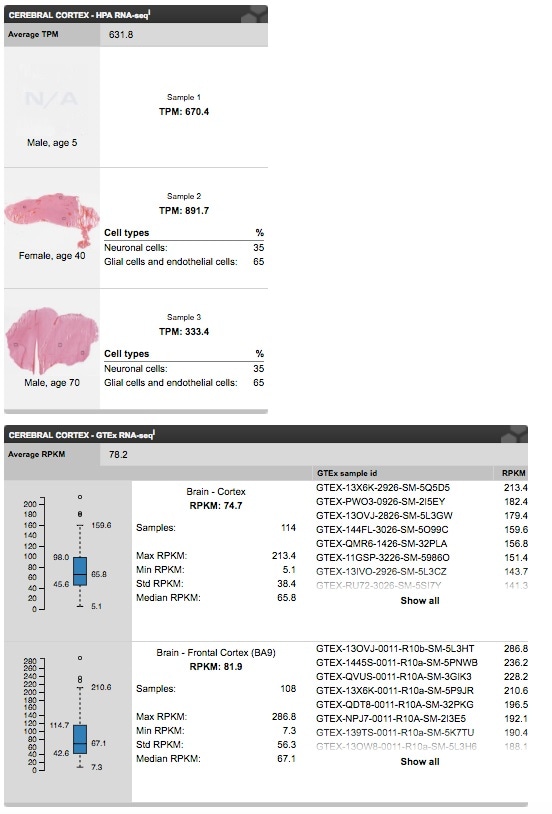
Figure 7. RNA-seq data for Aquaporin 4 generated by the Human Protein Atlas (top) and the GTEx RNA-seq data set. Image from the Human Protein Atlas portal.
4. See Antibody Stainings from 44 Tissues in the Primary Data Section
Clicking on the Primary data section takes one straight to the IHC images from 44 normal human tissues, including 76 distinct cell types. Pathology-based annotation of protein expression has been carried out for all tissues and images. The IHC images can be seen in high resolution by clicking on the various tissues.
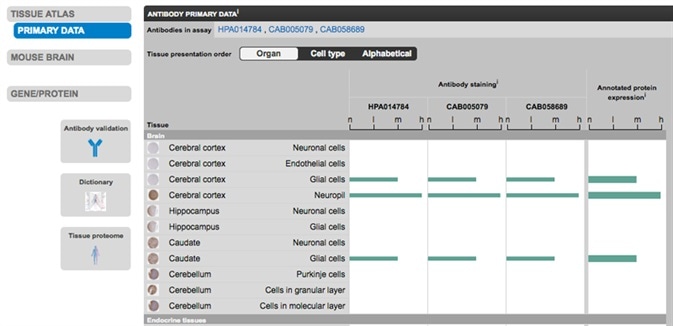
Figure 8. Primary Data section for Aquaporin 4, containing images for all tested normal tissues. Click on the respective tissue to see the images available. Image from the Human Protein Atlas portal.
5. View Stainings from Extended Tissue Profiling
In the newest version of the Tissue Atlas, lengthy tissue profiling was performed on several tissues that have not been displayed on the Human Protein Atlas before — eye, full section adrenal gland, lactating breast, and extended brain (hypothalamus, pituitary gland) and skin (hair follicle sweat glands) samples. If a particular antibody has been used for these lengthy analyses, these results can be achieved from the same view as for the 44 “standard” tissues. For demonstrating retina expression, PDE6B was selected as an example below.
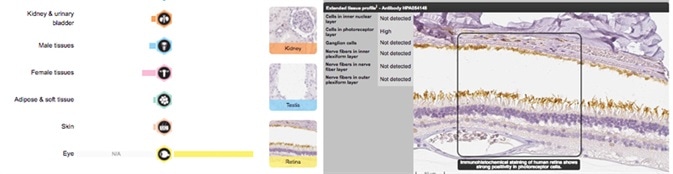
Figure 9. The image shows IHC staining of retina tissue using the Anti-PDE6B (HPA054148) antibody.
6. Get Details of RNA expression in the RNA Expression Overview
For each gene, RNA-data from three varied sources are shown: Internally generated Human Protein Atlas (HPA) RNA-seq data, RNA-seq data from the Genotype-Tissue Expression (GTEx) project, and CAGE data from FANTOM5 project (not shown here).
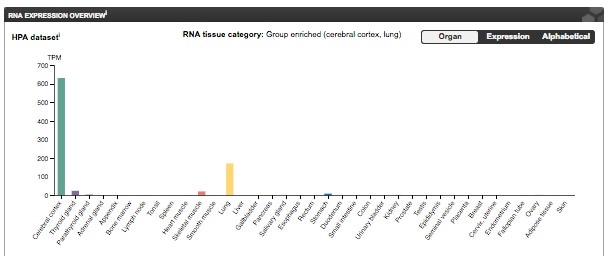
Figure 10. RNA Expression data for Aquaporin 4. Image from the Human Protein Atlas.
7. Find the Antibodies’ Antigen Position on the Target Gene
Scrolling down the Tissue Atlas gene page, you can find basic information regarding the gene/protein. In the protein browser section, the green horizontal bar signifies the precise amino acid position of the antigen on the target protein employed for antibody production. The various isoforms of AQP4 can be clicked in the different tabs.
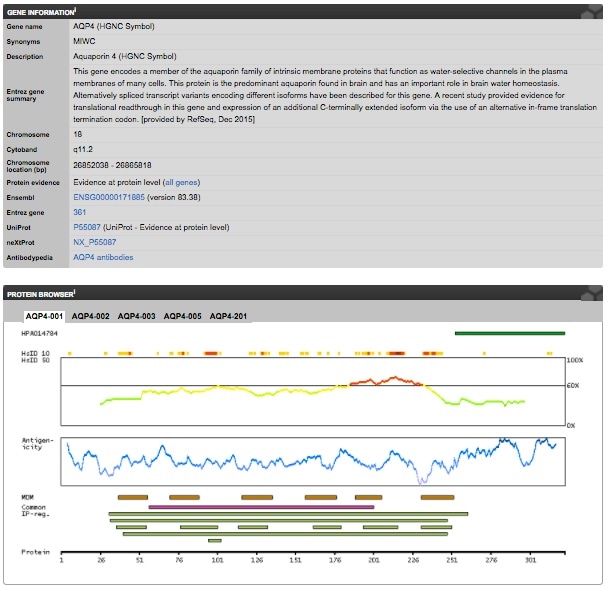
Figure 11. Gene and protein information for Aquaporin 4. Image from the Human Protein Atlas.
8. Explore Cancer Stainings in the Pathology Atlas
On top of the page, the Pathology tab is available. It takes you to the Cancer/Pathology Atlas for Aquaporin 4. The antibodies have been employed for staining tumor samples from up to 12 patients from 20 human cancers. The Pathology Atlas can be used to investigate differential expression between different patients, or between cancerous versus normal tissues. As in earlier sections, you can click on each tissue and see the entire cores in high resolution.
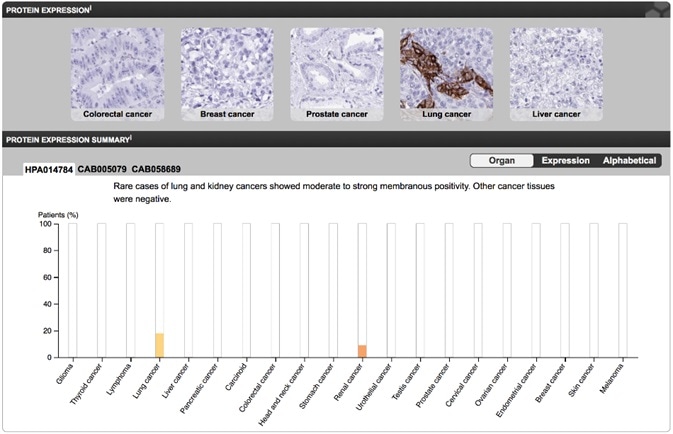
Figure 12. Antibody stainings from the 20 most common cancers performed for Aquaporin 4. Image from the Human Protein Atlas.
9. See Stainings of Whole Mouse Brain Sections
Up to now, 157 genes have been examined on the mouse brain, with all data available on the Tissue Atlas. The Mouse Brain section can be clicked on the left (if present for the required protein). The Anti-AQP4 antibody (HPA014784) has been used to stain Aquaporin 4, resulting in the labeling of astrocyte endnote. Sections of the entire mouse brain stained using fluorescence IHC with the same Anti-AQP4 antibody can be seen in high resolution, and 70 distinct brain regions have been annotated for this particular antibody.
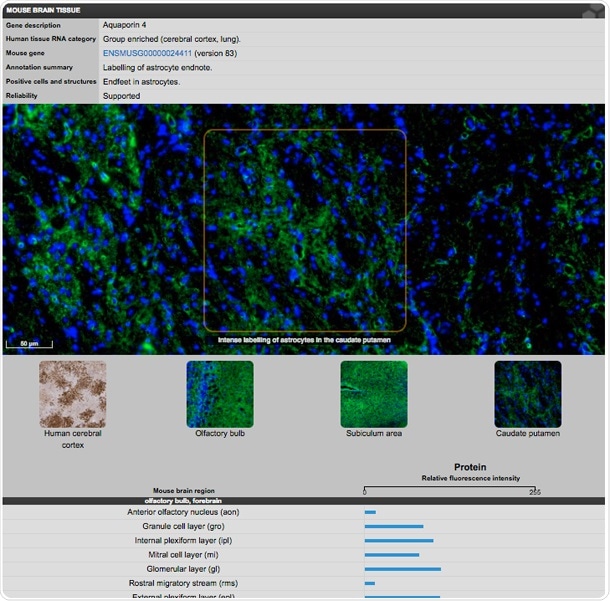
Figure 13. Mouse Brain Atlas entry for Aquaporin 4. Image from the Human Protein Atlas.
10. Antibody Validation in the Human Protein Atlas
The Antibody Validation symbol has to be clicked to enter a separate page illustrating the antibodies and antigens used and the validation in great detail. On this page, you can view all antibodies against the protein. The links in the Provider field takes one to the product pages to buy the antibodies. An example for Aquaporin 4 can be seen below.
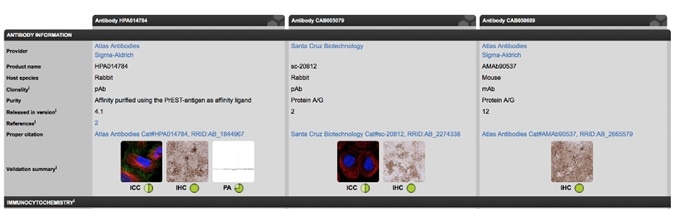
Figure 14. Information on individual antibodies against a protein is available on the Antibody Validation tab for the protein on the Human Protein Atlas.
All Triple A Polyclonals have been approved on protein arrays for precisely recognizing their corresponding antigens. The antibody staining results can be compared to RNA-seq data and the literature about the target protein, as well as to other antibodies against the same target.
Enhanced Validation
A concept of antibody validation, that is, Enhanced Validation, has been added to the Human Protein Atlas. The Enhanced Validation complements the basic validation always carried out. The concept is founded upon the guidelines suggested by a group of eminent scientists in an article published in Nature Methods in 2016 (Uhlén et al.; “A proposal for antibody validation”).
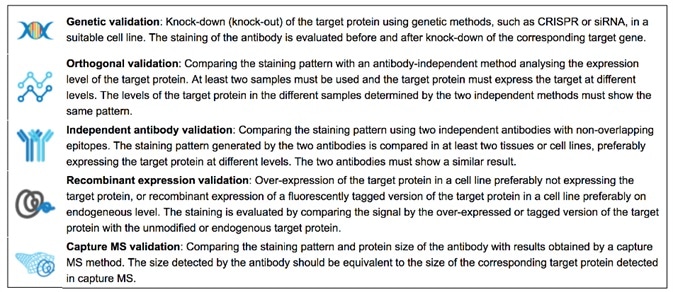
Figure 16. The Validation icons used on the Human Protein Atlas. Image from the Human Protein Atlas.
Atlas Antibodies
Atlas Antibodies provides the antibodies from the Human Protein Atlas. We offer a wide range of highly validated research antibodies – Triple A Polyclonals and PrecisA Monoclonals – targeting over 75% of the human proteome.
Triple A Polyclonals are primary antibodies developed and characterized within the Human Protein Altas project. The 21,000 rabbit polyclonal antibodies cover 75% of the human proteome and are validated in IHC, WB and ICC-IF. For each IHC antibody, you can explore 500 IHC images for each antibody.
PrecisA Monoclonals are primary mouse monoclonals with unique antigen design for optimal specificity. They are epitope mapped with defined specificity and isotyped for multiplexing.
Sponsored Content Policy: News-Medical.net publishes articles and related content that may be derived from sources where we have existing commercial relationships, provided such content adds value to the core editorial ethos of News-Medical.Net which is to educate and inform site visitors interested in medical research, science, medical devices and treatments.
Last updated: Oct 22, 2018 at 11:49 AM


.png)


No hay comentarios:
Publicar un comentario