COVID-19 Forecasts
Updated May 1, 2020
On This Page
Why Forecasting COVID-19 Deaths in the US is Critical
CDC is responding to a pandemic of coronavirus disease 2019 (COVID-19) caused by a novel coronavirus, SARS-CoV-2, that is spreading from person to person. The federal government is working closely with state, tribal, local, and territorial health departments, and other public health partners, to respond to this situation. Forecasts of deaths will help inform public health decision-making by projecting the likely impact in coming weeks.
What the Forecasts Aim to Predict
Forecasts based on the use of statistical or mathematical models (subsequently referred to as “models”) aim to predict changes in national- and state-level cumulative reported COVID-19 deaths for the next four weeks. Forecasting teams predict numbers of deaths using different types of data (e.g., COVID-19 data, demographic data, mobility data), methods (see below), and estimates for the impacts of interventions (e.g. social distancing, use of face coverings).
Interpretation of Forecasts
- This week’s forecasts include national- and state-level forecasts from additional modeling groups and “ensemble” forecasts that summarize the information from the individual forecasts.
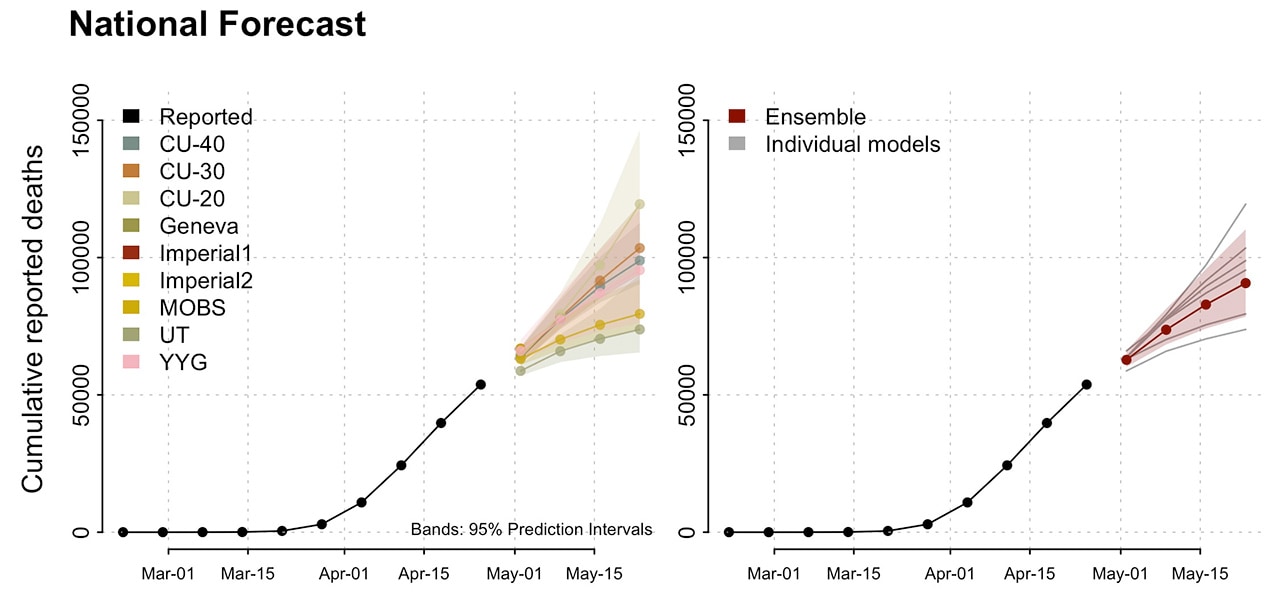
- National-level forecasts continue to indicate that deaths are likely to rise in the coming weeks. How quickly they will increase remains uncertain and is dependent on forecast assumptions about the strength and coverage of social distancing behaviors that continue over this period.
- State-level ensemble forecasts (only shown for states and territories with at least two forecasts) indicate a slowed growth in new deaths for most states.
National Forecast

- These forecasts show cumulative reported COVID-19 deaths since February and forecasted deaths for the next four weeks in the United States.
- The CU models make various assumptions about the effectiveness of current interventions. All other models assume that existing social distancing measures will continue through the time period shown.
State Forecasts
State level forecasts show observed and forecasted state level cumulative COVID-19 deaths in the US.
Forecasts fall into one of three categories
- The LANL and UMass-MB models do not explicitly model the effects of individual social distancing measures but assume that implemented interventions will continue, resulting in decreased growth.
- The Geneva, MIT, MOBS, UT, and YYG models are conditional on existing social distancing measures continuing through the projected time period.
- The CU models make different assumptions about the effectiveness of current social distancing interventions.
Working to Bring Together Forecasts for COVID-19 Deaths in the US
CDC works with partners to bring together weekly forecasts for COVID-19 deaths in one place. These forecasts have been developed independently and shared publicly. It is important to bring these forecasts together to help understand how they compare with each other and how much uncertainty there is about what may happen in the upcoming four weeks.
Columbia University
Model names: CU 20% contact reduction, CU 30% contact reduction, CU 40% contact reduction
Intervention assumptionsThese models are based on assumptions of reducing the number of contacts per case. Three different adaptive scenarios of contact reduction are projected: 20%, 30%, and 40% contact reduction in US counties with at least 10 cases. Additional reductions are implemented with additional new cases, and all social distancing interventions remain in place until the end of the projection.
Methods
Metapopulation SEIR model
Metapopulation SEIR model
Imperial College, London
Model names: Imperial1, Imperial2
Intervention Assumptions:
These projections do not make any specific assumptions about which interventions have been or will remain in place.
Methods: Ensembles of mechanistic transmission models, fit to different parameter assumptions.
Los Alamos National Laboratory (state-level forecasts only)
Model name: LANL
Intervention assumptions
Currently implemented interventions and the corresponding reductions in transmission will continue, resulting in an overall decrease in the growth rate of COVID-19. Over the course of the forecast, the model assumes that the growth will decrease over time.
Currently implemented interventions and the corresponding reductions in transmission will continue, resulting in an overall decrease in the growth rate of COVID-19. Over the course of the forecast, the model assumes that the growth will decrease over time.
Methods
Statistical dynamical growth model accounting for population susceptibility
Statistical dynamical growth model accounting for population susceptibility
Massachusetts Institute of Technology
Model names: MIT
Intervention Assumptions: The projections assume that current interventions will remain in place indefinitely.
Methods: SEIR model fit to reported death and case counts.
Northeastern
Model name: MOBS (Laboratory for the Modeling of Biological + Socio-technical Systems)
Intervention assumptions
The projections assume that social distancing policies in place at the date of calibration are extended for the future weeks.
The projections assume that social distancing policies in place at the date of calibration are extended for the future weeks.
Methods
Metapopulation, age-structured SLIR model
Metapopulation, age-structured SLIR model
University of Geneva (one-week ahead forecasts only)
Model name: Geneva
Intervention assumptions
The projections assume that social distancing policies in place at the date of calibration are extended for the future weeks.
The projections assume that social distancing policies in place at the date of calibration are extended for the future weeks.
Methods
Exponential and linear statistical models fit to the recent growth rate of cumulative deaths.
Exponential and linear statistical models fit to the recent growth rate of cumulative deaths.
University of Massachusetts, Amherst
Model name: UMass-MB
Intervention assumptions
These projections do not make any specific assumptions about which interventions have been or will remain in place.
These projections do not make any specific assumptions about which interventions have been or will remain in place.
Methods: Mechanistic Bayesian compartment model.
University of Texas, Austin
Model name: UT
Intervention assumptionsEstimates the extent of social distancing using geolocation data from mobile phones and assumes that the extent of social distancing does not change during the period of forecasting. The model is designed to predict confirmed COVID-19 deaths resulting from only a single wave of transmission.
Methods
Nonlinear Bayesian hierarchical regression with a negative-binomial model for daily variation in death rates.
Nonlinear Bayesian hierarchical regression with a negative-binomial model for daily variation in death rates.
Youyang Gu (COVID-Projections)
Model name: YYG
Intervention assumptions
The projections assume that strong social distancing policies will remain in place through the projected period.
The projections assume that strong social distancing policies will remain in place through the projected period.
Methods
SEIS mechanistic model.
SEIS mechanistic model.
Additional Resources:


No hay comentarios:
Publicar un comentario