sábado, 24 de noviembre de 2018

CDC - Data and Statistics - Chronic Obstructive Pulmonary Disease (COPD)

CDC - Data and Statistics - Chronic Obstructive Pulmonary Disease (COPD)

Centers for Disease Control and Prevention. CDC twenty four seven. Saving Lives, Protecting People

COPD Death Rates in the United States

Line graph of COPD death rates in the United States 1999 to 2014

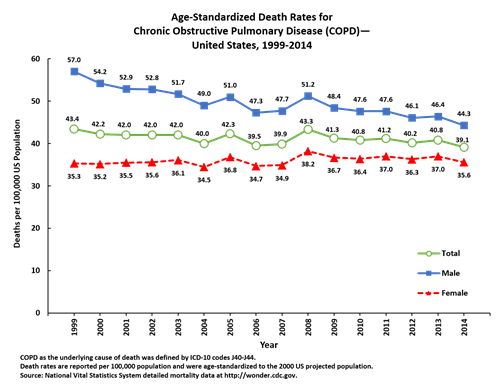
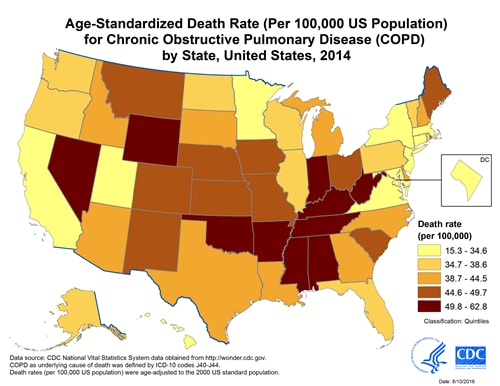
Although age-adjusted death rates for COPD declined among US men from 1999 (57.0 per 100,000) to 2014 (44.3 per 100,000), death rates have not changed significantly among US women (35.3 per 100,000 in 1999 and 35.6 per 100,000 in 2014). Age-adjusted death rates varied between states (see figure below) in 2014 and ranged from 15.3 per 100,000 in Hawaii to 62.8 per 100,000 in Kentucky. States with the highest COPD death rates are clustered along the Ohio and Mississippi Rivers.
Map of COPD prevalence in the United States 2014 displaying age-standardized death rates for chronic obstructive pulmonary disease (COPD), by State. State rates are grouped into quintiles. Data were obtained from the National Vital Statistics System at http://wonder.cdc.gov. COPD as the underlying cause of death was defined by ICD-10 codes J40-J44. Death rates are reported per 100,000 population and were age-standardized to the 2000 US standard population. Age standardized Death Rate per 100,000. 15.3 to 34.6 – California, Connecticut, District of Columbia, Hawaii, Maryland, Massachusetts, Minnesota, New Jersey, New York, Utah, Virginia. 34.7 to 38.6 – Alaska, Florida, Illinois, North Dakota, Oregon, Pennsylvania, Rhode Island, Vermont, Washington, Wisconsin. 38.7 to 44.5 – Arizona, Delaware, Georgia, Idaho, Louisiana, Michigan, New Hampshire, North Carolina, South Dakota, Texas. 44.6 to 49.7 – Colorado, Iowa, Kansas, Maine, Missouri, Montana, Nebraska, New Mexico, Ohio, South Carolina. 49.8 to 62.8 – Alabama, Arkansas, Indiana, Kentucky, Mississippi, Nevada, Oklahoma, Tennessee, West Virginia, Wyoming.

COPD Prevalence in the United States

The figure shows age-adjusted prevalence of chronic obstructive pulmonary disease (COPD) among adults in the United States during 2014.  The prevalence of COPD varies considerably by state, from <4% in Hawaii, Colorado, and Utah to >9% in Alabama, Tennessee, Kentucky, and West Virginia. The states with the highest COPD prevalence are clustered along the Ohio and lower Mississippi Rivers. Age-adjusted prevalence of COPD by state. 3.5% to 4.7% – Alaska, California, Colorado, Connecticut, Hawaii, Idaho, Minnesota, North Dakota, Utah, Wisconsin, Puerto Rico. 4.8% to 5.6% – Illinois, Iowa, Maryland, Nebraska, New Jersey, New Mexico, New York, Oregon, Rhode Island, South Dakota, Texas, Vermont. 5.7% to 6.4% – Delaware, District of Columbia, Kansas, Massachusetts, Montana, New Hampshire, Pennsylvania, Virginia, Washington, Wyoming. 6.5% to 7.5% – Arizona, Florida, Georgia, Louisiana, Maine, Mississippi, Missouri, Nevada, North Carolina, Ohio, Oklahoma, South Carolina. 7.6% to 12.3% – Alabama, Arkansas, Indiana, Kentucky, Michigan, Tennessee, West Virginia.

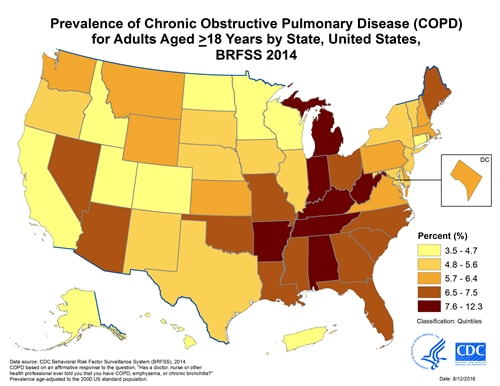
The previous figure shows age-adjusted prevalence of COPD among adults in the United States during 2014.  The prevalence of COPD varies considerably by state, from <4% in Hawaii, Colorado, and Utah to >9% in Alabama, Tennessee, Kentucky, and West Virginia. States with the highest COPD prevalence are clustered along the Ohio and lower Mississippi Rivers.
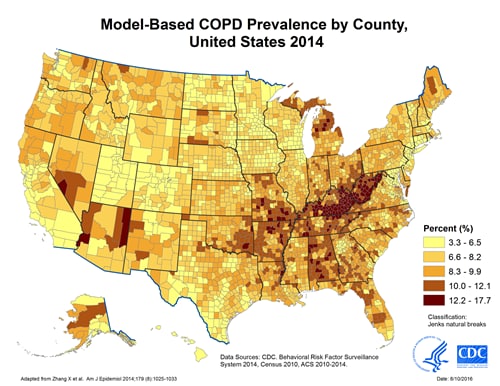
Although the Behavioral Risk Factor Surveillance System (BRFSS) survey provides data critical for monitoring national and state population health, it does not have sufficient samples to produce direct survey estimates for most counties or subcounty areas. Therefore, BRFSS data were used to develop statistical models estimating COPD prevalence at different geographic levels, including counties, congressional districts, and census tracts. These estimates could be used in a variety of contexts and meet the diverse small-area health data needs of local policy makers, program planners, and communities for public health program planning and evaluation.
The maps below present model-based COPD prevalence by county, congressional district, and census tract.1
Map displaying model-based prevalence of chronic obstructive pulmonary disease (COPD), by county in the United States, 2014. Data sources for development of model included CDC’s Behavioral Risk Factor Surveillance System (2014), the U.S. Census (2010), and the American Community Survey (2010-2014). County COPD prevalence estimates ranged from 3.3% to 17.7%.

Map displaying model-based prevalence of chronic obstructive pulmonary disease (COPD), by congressional district in the United States, 2014. Data sources for development of model included CDC’s Behavioral Risk Factor Surveillance System (2014), the U.S. Census (2010), and the American Community Survey (2010-2014). Congressional district COPD prevalence estimates ranged from 3.4% to 14.0%.

Map displaying model-based prevalence of chronic obstructive pulmonary disease (COPD), by census tract in the United States, 2014. Data sources for development of model included CDC’s Behavioral Risk Factor Surveillance System (2014), the U.S. Census (2010), and the American Community Survey (2010-2014). Census tract COPD prevalence estimates ranged from 0.9% to 29.6%.

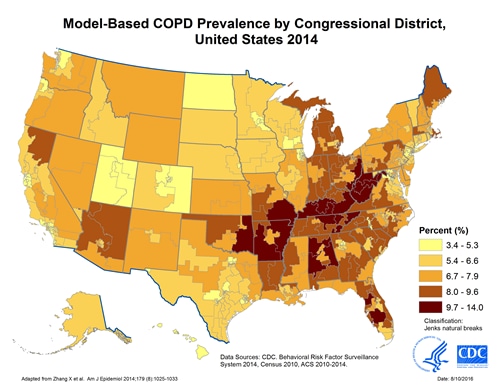
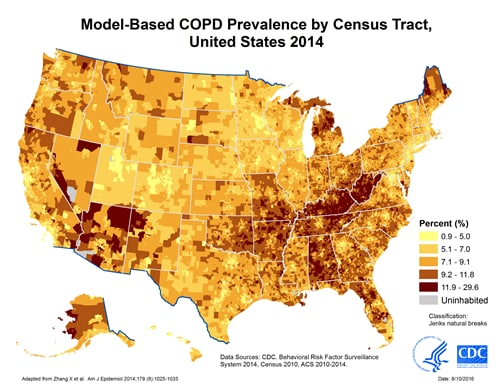
  1. Zhang X, Holt JB, Lu H, et al. Multilevel regression and poststratification for small area estimation of population health outcomes: a case study of chronic obstructive pulmonary disease prevalence using BRFSS. Am J Epidemiol. 2014;179(8):1025–1033.

Work-Related Lung Disease (eWoRLD) Surveillance System

This CDC national surveillance system is maintained by the National Institute for Occupational Safety and Health (NIOSH). It includes up-to-date summary tables, graphs, and figures of occupation-related respiratory disease surveillance data on pneumoconioses, occupational asthma and other airway diseases, and several other respiratory conditions, including COPD. Learn more about the Work-Related Lung Disease Surveillance System.

No hay comentarios:

Publicar un comentario