O2 Discovering the building blocks of hearing: a data-driven, neuro-inspired approach
Lotte Weerts1, Claudia Clopath2, Dan Goodman1
1Imperial College London, Electrical and Electronic Engineering, London, United Kingdom; 2Imperial College London, Department of Bioengineering, London, United Kingdom
Correspondence: Dan Goodman (d.goodman@imperial.ac.uk)
BMC Neuroscience 2019, 20(Suppl 1):O2
Our understanding of hearing and speech recognition rests on controlled experiments requiring simple stimuli. However, these stimuli often lack the variability and complexity characteristic of complex sounds such as speech. We propose an approach that combines neural modelling with data-driven machine learning to determine auditory features that are both theoretically powerful and can be extracted by networks that are compatible with known auditory physiology. Our approach bridges the gap between detailed neuronal models that capture specific auditory responses, and research on the statistics of real-world speech data and its relationship to speech recognition. Importantly, our model can capture a wide variety of well studied features using specific parameter choices, and allows us to unify several concepts from different areas of hearing research.
We introduce a feature detection model with a modest number of parameters that is compatible with auditory physiology. We show that this model is capable of detecting a range of features such as amplitude modulations (AMs) and onsets. In order to objectively determine relevant feature detectors within our model parameter space, we use a simple classifier that approximates the information bottleneck, a principle grounded in information theory that can be used to define which features are “useful”. By analysing the performance in a classification task, our framework allows us to determine the best model parameters and their neurophysiological implications and relate those to psychoacoustic findings.
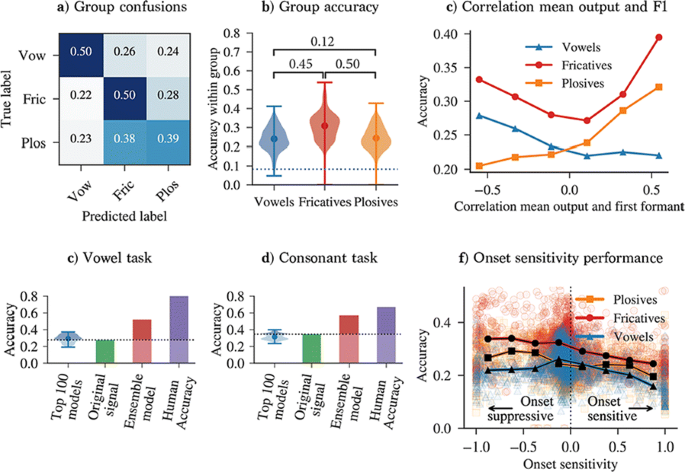
We analyse the performance of a range of model variants in a phoneme classification task (Fig. 1). Some variants improve accuracy compared to using the original signal, indicating that our feature detection model extracts useful information. By analysing the properties of high performing variants, we rediscover several proposed mechanisms for robust speech processing. Firstly, our result suggest that model variants that can detect and distinguish between formants are important for phoneme recognition. Secondly, we rediscover the importance of AM sensitivity for consonant recognition, which is in line with several experimental studies that show that consonant recognition is degraded when certain amplitude modulations are removed. Besides confirming well-known mechanisms, our analysis hints at other less-established ideas, such as the importance of onset suppression. Our results indicate that onset suppression can improve phoneme recognition, which is in line with the hypothesis that the suppression of onset noise (or “spectral splatter”), as observed in the mammalian auditory brainstem, can improve the clarity of a neural harmonic representation. We also discover model variants that are responsive to more complex features, such as combined onset and AM sensitivity. Finally, we show how our approach lends itself to be extended to more complex environments, by distorting the clean speech signal with noise.
a Between-group confusion matrix for best parameters. b distribution of within-group accuracies and between-group accuracy correlations. c Within-group accuracy and correlation of model output and spectral peaks. d, e Accuracy achieved with model variants, the original filtered signal, and ensemble models on a vowel (d) and consonant (e) task. f Within-group accuracy versus onset strength
Our approach has various potential applications. Firstly, it could lead to new, testable experimental hypotheses for understanding hearing. Moreover, promising features could be directly applied as a new acoustic front-end for speech recognition systems.
Acknowledgments: This work was partly supported by a Titan Xp donated by the NVIDIA Corporation, The Royal Society grant RG170298 and the Engineering and Physical Sciences Research Council (grant number EP/L016737/1).
O3 Modeling stroke and rehabilitation in mice using large-scale brain networks
Spase Petkoski1, Anna Letizia Allegra Mascaro2, Francesco Saverio Pavone2, Viktor Jirsa1
1Aix-Marseille Université, Institut de Neurosciences des Systèmes, Marseille, France; 2University of Florence, European Laboratory for Non-linear Spectroscopy, Florence, Italy
Correspondence: Spase Petkoski (spase.petkoski@univ-amu.fr)
BMC Neuroscience 2019, 20(Suppl 1):O3
Individualized large-scale computational modeling of the dynamics associated with the brain pathologies [1] is an emerging approach in the clinical applications, which gets validation through animal models. A good candidate for confirmation of brain network causality is stroke and the subsequent recovery, which alter brain’s structural connectivity, and this is then reflected on functional and behavioral level. In this study we use large-scale brain network model (BNM) to computationally validate the structural changes due to stroke and recovery in mice, and their impact on the resting state functional connectivity (FC), as captured by wide-field calcium imaging.
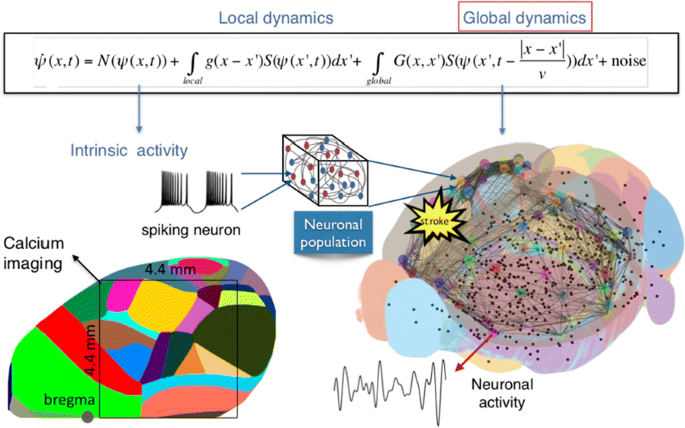
We built our BNM based on the detailed Allen Mouse (AM) connectome that is implemented in The Virtual Mouse Brain [2]. It dictates the strength of the couplings between distant brain regions based on tracer data. The homogeneous local connectivity is absorbed into the neuronal mass model that is generally derived from mean activity of populations of spiking neurons, Fig. 1, and is here represented by the Kuramoto oscillators [3], as canonical model for network synchronization due to weak interactions. The photothrombotic focal stroke affects the right primary motor cortex (rM1). The injured forelimb is daily trained on a custom designed robotic device (M-Platform, [4, 5]) from 5 days after the stroke for a total of 4 weeks. The stroke is modeled by different levels of damage of the links connecting rM1, while the recovery is represented by reinforcing of alternative connections of the nodes initially linked to it [6]. We systematically simulate various impacts of stroke and recovery, to find the best match with the coactivation patterns in the data, where the FC is characterized with the phase coherence calculated for the phases of Hilbert transformed delta frequency activity of pixels within separate regions [6]. Statistically significant changes within the FC of 5 animals are obtained for transitions between the three conditions: healthy, stroke and rehabilitation after 4 weeks of training, and these are compared with the best fits for each condition of the model in the parameter’s space of the global coupling strength and stroke impact and rewiring.
The equation of the mouse BNM shows that the spatiotemporal dynamics is shaped by the connectivity. The brain network (right) is reconstructed from the AMA, showing the centers of sub cortical (small black dots) and cortical (colored circles) regions. On the left, the field of view during the recordings is overlayed on the reconstructed brain, and different colors represent the cortical regions
This approach uncovers recovery paths in the parameter space of the dynamical system that can be related to neurophysiological quantities such as the white matter tracts. This can lead to better strategies for rehabilitation, such as stimulation or inhibition of certain regions and links that have a critical role on the dynamics of the recovery.
References
- 1.Olmi S, Petkoski S, Guye M, Bartolomei F, Jirsa V. Controlling seizure propagation in large-scale brain networks. PLoS Comp Biol. [in press]
- 2.Melozzi F, Woodman MM, Jirsa VK, Bernard C. The Virtual Mouse Brain: A computational neuroinformatics platform to study whole mouse brain dynamics. eNeuro 0111-17. 2017.
- 3.Petkoski S, Palva JM, Jirsa VK. Phase-lags in large scale brain synchronization: Methodological considerations and in-silico analysis. PLoS Comp Biol, 14(7), 1–30. 2018.
- 4.Spalletti C, et al. A robotic system for quantitative assessment and poststroke training of forelimb retraction in mice. Neurorehabilitation and neural repair 28, 188–196. 2014.
- 5.Allegra Mascaro, A et al. Rehabilitation promotes the recovery of distinct functional and structural features of healthy neuronal networks after stroke. [under review].
- 6.Petkoski S, et al. Large-scale brain network model for stroke and rehabilitation in mice. [in prep].
O4 Self-consistent correlations of randomly coupled rotators in the asynchronous state
Alexander van Meegen1, Benjamin Lindner2
1Jülich Research Centre, Institute of Neuroscience and Medicine (INM-6) and Institute for Advanced Simulation (IAS-6), Jülich, Germany; 2Humboldt University Berlin, Physics Department, Berlin, Germany
Correspondence: Alexander van Meegen (a.van.meegen@fz-juelich.de)
BMC Neuroscience 2019, 20(Suppl 1):O4
Spiking activity of cortical neurons in behaving animals is highly irregular and asynchronous. The quasi stochastic activity (the network noise) does not seem to root in the comparatively weak intrinsic noise sources but is most likely due to the nonlinear chaotic interactions in the network. Consequently, simple models of spiking neurons display similar states, the theoretical description of which has turned out to be notoriously difficult. In particular, calculating the neuron’s correlation function is still an open problem. One classical approach pioneered in the seminal work of Sompolinsky et al. [1] used analytically tractable rate units to obtain a self-consistent theory of the network fluctuations and the correlation function of the single unit in the asynchronous irregular state. Recently, the original model attracted renewed interest, leading to substantial extensions and a wide range of novel results [2–5].
Here, we develop a theory for a heterogeneous random network of unidirectionally coupled phase oscillators [6]. Similar to Sompolinsky’s rate-unit model, the system can attain an asynchronous state with pronounced temporal autocorrelations of the units. The model can be examined analytically and even allows for closed-form solutions in simple cases. Furthermore, with a small extension, it can mimic mean-driven networks of spiking neurons and the theory can be extended to this case accordingly.
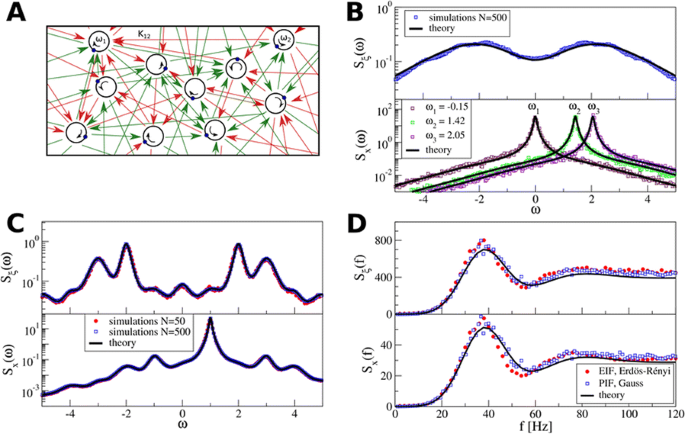
Specifically, we derived a differential equation for the self-consistent autocorrelation function of the network noise and of the single oscillators. Its numerical solution has been confirmed by simulations of sparsely connected networks (Fig. 1). Explicit expressions for correlation functions and power spectra for the case of a homogeneous network (identical oscillators) can be obtained in the limits of weak or strong coupling strength. To apply the model to networks of sparsely coupled excitatory and inhibitory exponential integrate-and-fire (IF) neurons, we extended the coupling function and derived a second differential equation for the self-consistent autocorrelations. Deep in the mean-driven regime of the spiking network, our theory is in excellent agreement with simulations results of the sparse network.
Sketch of a random network of phase oscillators. a Self-consistent power spectra of network noise and single units (b–d), upper and lower plots respectively) obtained from simulations (colored symbols) compared with the theory (black lines): Heterogeneous b and homogeneous c networks of phase oscillators, and sparsely coupled IF networks (d). Panels b–d adapted and modified from [6]
This work paves the way for more detailed studies of how the statistics of connection strength, the heterogeneity of network parameters, and the form of the interaction function shape the network noise and the autocorrelations of the single element in asynchronous irregular state.
References
- 1.Sompolinsky H, Crisanti A, Sommers HJ. Chaos in random neural networks. Physical review letters 1988 Jul 18;61(3):259.
- 2.Kadmon J, Sompolinsky H. Transition to chaos in random neuronal networks. Physical Review X 2015 Nov 19;5(4):041030.
- 3.Mastrogiuseppe F, Ostojic S. Linking connectivity, dynamics, and computations in low-rank recurrent neural networks. Neuron 2018 Aug 8;99(3):609-23.
- 4.Schuecker J, Goedeke S, Helias M. Optimal sequence memory in driven random networks. Physical Review X 2018 Nov 14;8(4):041029.
- 5.Muscinelli SP, Gerstner W, Schwalger T. Single neuron properties shape chaotic dynamics in random neural networks. arXiv preprint arXiv:1812.06925 2018 Dec 17.
- 6.van Meegen A, Lindner B. Self-Consistent Correlations of Randomly Coupled Rotators in the Asynchronous State. Physical review letters 2018 Dec 20;121(25):258302.
O5 Firing rate-dependent phase responses dynamically regulate Purkinje cell network oscillations
Yunliang Zang, Erik De Schutter
Okinawa Institute of Science and Technology, Computational Neuroscience Unit, Onna-Son, Japan
Correspondence: Yunliang Zang (zangyl1983@gmail.com)
BMC Neuroscience 2019, 20(Suppl 1):O5
Phase response curves (PRCs) have been defined to quantify how a weak stimulus shift the next spike timing in regular firing neurons. However, the biophysical mechanisms that shape the PRC profiles are poorly understood. The PRCs in Purkinje cells (PCs) show firing rate (FR) adaptation. At low FRs, the responses are small and phase independent. At high FRs, the responses become phase dependent at later phases, with their onset phases gradually left-shifted and peaks gradually increased, due to an unknown mechanism [1, 2].
Using our recently developed compartment-based PC model [3], we reproduced the FR-dependence of PRCs and identified the depolarized interspike membrane potential as the mechanism underlying the transition from phase-independent responses at low FRs to the gradually left-shifted phase-dependent responses at high FRs. We also demonstrated this mechanism plays a general role in shaping PRC profiles in other neurons.
PC axon collaterals have been proposed to correlate temporal spiking in PC ensembles [4, 5], but whether and how they interact with the FR-dependent PRCs to regulate PC output remains unexplored. We built a recurrent inhibitory PC-to-PC network model to examine how FR-dependent PRCs regulate the synchrony of high frequency (~ 160 Hz) oscillations observed in vivo [4]. We find the synchrony of these oscillations increases with FR due to larger and broader PRCs at high FRs. This increased synchrony still holds when the network incorporates dynamically and heterogeneously changing cellular FRs. Our work implies that FR-dependent PRCs may be a critical property of the cerebellar cortex in combining rate- and synchrony-coding to dynamically organize its temporal output.
References
- 1.Phoka E., et al., A new approach for determining phase response curves reveals that Purkinje cells can act as perfect integrators. PLoS Comput. Biol 2010. 6(4): p. e1000768.
- 2.Couto J., et al., On the firing rate dependency of the phase response curve of rat Purkinje neurons in vitro. PLoS Comput. Biol 2015. 11(3): p. e1004112.
- 3.Zang Y, Dieudonne S, De Schutter E. Voltage- and Branch-Specific Climbing Fiber Responses in Purkinje Cells. Cell Rep 2018. 24(6): p. 1536-1549.
- 4.de Solages C., et al., High-frequency organization and synchrony of activity in the purkinje cell layer of the cerebellum. Neuron 2008. 58(5): p. 775-88.
- 5.Witter L., et al., Purkinje Cell Collaterals Enable Output Signals from the Cerebellar Cortex to Feed Back to Purkinje Cells and Interneurons. Neuron 2016. 91(2): p. 312-9.
O6 Computational modeling of brainstem-spinal circuits controlling locomotor speed and gait
Ilya Rybak, Jessica Ausborn, Simon Danner, Natalia Shevtsova
Drexel University College of Medicine, Department of Neurobiology and Anatomy, Philadelphia, PA, United States of America
Correspondence: Ilya Rybak (rybak@drexel.edu)
BMC Neuroscience 2019, 20(Suppl 1):O6
Locomotion is an essential motor activity allowing animals to survive in complex environments. Depending on the environmental context and current needs quadruped animals can switch locomotor behavior from slow left-right alternating gaits, such as walk and trot (typical for exploration), to higher-speed synchronous gaits, such as gallop and bound (specific for escape behavior). At the spinal cord level,the locomotor gait is controlled by interactions between four central rhythm generators (RGs) located on the left and right sides of the lumbar and cervical enlargements of the cord, each producing rhythmic activity controlling one limb. The activities of the RGs are coordinated by commissural interneurons (CINs), projecting across the midline to the contralateral side of the cord, and long propriospinal neurons (LPNs), connecting the cervical and lumbar circuits. At the brainstem level, locomotor behavior and gaitsare controlled by two majorbrainstem nuclei: the cuneiform (CnF) and the pedunculopontine (PPN) nuclei [1]. Glutamatergic neurons in both nuclei contribute to the control of slow alternating-gait movements, whereas only activation of CnF can elicit high-speed synchronous-gait locomotion. Neurons from both regions project to the spinal cord via descendingreticulospinal tracts from thelateral paragigantocellular nuclei (LPGi) [2].
To investigate the brainstem control of spinal circuits involved in the slow exploratory and fast escape locomotion, we built a computational model ofthe brainstem-spinal circuits controlling these locomotor behaviors. The spinal cord circuits in the modelincluded four RGs (one per limb) interacting via cervical and lumbar CINs and LPNs. The brainstem model incorporated bilaterally interacting CnF and PPN circuits projecting to the LPGi nuclei that mediated the descending pathways to the spinal cord.These pathways provided excitation of all RGs to control locomotor frequency and inhibited selected CINs and LPNs, which allowed the model to reproduce the speed-dependent gait transitions observed in intact mice and the loss of particular gaits in mutants lacking some genetically identified CINs [3].The proposed structure of synaptic inputs of the descending (LPGi) pathways to the spinal CINs and LPNs allowed the model to reproduce the experimentally observed effects of stimulation of excitatory and inhibitory neurons within CnF, PPN, and LPGi. The suggests explanations for (a) the speed-dependent expression of different locomotor gaits and the role of different CINs and LPNs in gait transitions, (b) the involvement of the CnF and PPN nuclei in the control of low-speed alternating-gait locomotion and the specific role of the CnF in the control of high-speed synchronous-gait locomotion, and (c) the role of inhibitory neurons in these areas in slowing down and stopping locomotion. The model provides important insights into the brainstem-spinal cord interactions and the brainstem control of locomotor speed and gaits.
References
- 1.Caggiano V, Leiras R, Goñi-Erro H, et al. Midbrain circuits that set locomotor speed and gait selection. Nature 2018, 553, 455–460.
- 2.Capelli P, Pivetta C, Esposito MS, Arber S. Locomotor speed control circuits in the caudal brainstem. Nature 2017, 551, 373–377.
- 3.Bellardita C, Kiehn O. Phenotypic characterization of speed-associated gait changes in mice reveals modular organization of locomotor networks. Curr Biol 2015, 25, 1426–1436.
O7 Co-refinement of network interactions and neural response properties in visual cortex
Sigrid Trägenap1, Bettina Hein1, David Whitney2, Gordon Smith3, David Fitzpatrick2, Matthias Kaschube1
1Frankfurt Institute for Advanced Studies (FIAS), Department of Neuroscience, Frankfurt, Germany; 2Max Planck Florida Institute, Department of Neuroscience, Jupiter, FL, United States of America; 3University of Minnesota, Department of Neuroscience, Minneapolis, MN, United States of America
Correspondence: Sigrid Trägenap (traegenap@fias.uni-frankfurt.de)
BMC Neuroscience 2019, 20(Suppl 1):O7
In the mature visual cortex, local tuning properties are linked through distributed network interactions with a remarkable degree of specificity [1]. However, it remains unknown whether the tight linkage between functional tuning and network structure is an intrinsic feature of cortical circuits, or instead gradually emerges in development. Combining virally-mediated expression of GCAMP6s in pyramidal neurons with wide-field epifluorescence imaging in ferret visual cortex, we longitudinally monitored the spontaneous activity correlation structure—our proxy for intrinsic network interactions- and the emergence of orientation tuning around eye-opening.
We find that prior to eye-opening, the layout of emerging iso-orientation domains is only weakly similar to the spontaneous correlation structure. Nonetheless within one week of visual experience, the layout of iso-orientation domains and the spontaneous correlation structure become rapidly matched. Motivated by these observations, we developed dynamical equations to describe how tuning and network correlations co-refine to become matched with age. Here we propose an objective function capturing the degree of consistency between orientation tuning and network correlations. Then by gradient descent of this objective function, we derive dynamical equations that predict an interdependent refinement of orientation tuning and network correlations. To first approximation, these equations predict that correlated neurons become more similar in orientation tuning over time, while network correlations follow a relaxation process increasing the degree of self-consistency in their link to tuning properties.
Empirically, we indeed observe a refinement with age in both orientation tuning and spontaneous correlations. Furthermore, we find that this framework can utilize early measurements of orientation tuning and correlation structure to predict aspects of the future refinement in orientation tuning and spontaneous correlations. We conclude that visual response properties and network interactions show a considerable degree of coordinated and interdependent refinement towards a self-consistent configuration in the developing visual cortex.
Reference
- 1.Smith GB, Hein B, Whitney DE, Fitzpatrick D, Kaschube M. Distributed network interactions and their emergence in developing neocortex. Nature Neuroscience 2018 Nov;21(11):1600.
O8 Receptive field structure of border ownership-selective cells in response to direction of figure
Ko Sakai1, Kazunao Tanaka1, Rüdiger von der Heydt2, Ernst Niebur3
1University of Tsukuba, Department of Computer Science, Tsukuba, Japan; 2Johns Hopkins University, Krieger Mind/Brain Institute, Baltimore, United States of America; 3Johns Hopkins, Neuroscience, Baltimore, MD, United States of America
Correspondence: Ko Sakai (sakai@cs.tsukuba.ac.jp)
BMC Neuroscience 2019, 20(Suppl 1):O8
The responses of border ownership-selective cells (BOCs) have been reported to signal the direction of figure (DOF) along the contours in natural images with a variety of shapes and textures [1]. We examined the spatial structure of the optimal stimuli for BOCs in monkey visual cortical area V2 to determine the structure of the receptive field. We computed the spike triggered average (STA) from responses of the BOCs to natural images (JHU archive, http://dx.doi.org/10.7281/T1C8276W). To estimate the STA in response to figure-ground organization of natural images, we tagged figure regions with luminance contrast. The left panel in Fig 1 illustrates the procedure for STA computation. We first aligned all images to a given cell’s preferred orientation and preferred direction of figure. We then grouped the images based on the luminance contrast of their figure regions with respect to their ground regions, and averaged them separately for each group. By averaging the bright-figure stimuli with weights based on each cell’s spike count, we were able to observe the optimal figure and ground sub-regions as brighter and darker regions, respectively. By averaging the dark-figure stimuli, we obtained the reverse. We then generated the STA by subtracting the average of the dark-figure stimuli from that of the bright-figure stimuli. This subtraction canceled out the dependence of response to contrast. We compensated for the bias due to the non-uniformity of luminance in the natural images by subtracting the simple ensemble average of the stimuli (equivalent to weight = 1 for all stimuli) from the weighted average. The mean STA across 22 BOCs showed facilitated and suppressed sub-regions in response to the figure towards the preferred and non-preferred DOFs, respectively (Fig. 1, the right panel). The structure was shown more clearly when figure and ground were replaced by a binary mask. The result demonstrates, for the first time, the antagonistic spatial structure in the receptive field of BOCs in response to figure-ground organization.
(Left) We tagged figure regions with luminance contrast to compute the STA in response to figure-ground organization. Natural images with bright foreground were weighted by the cell’s spike counts and summed. The analogue was computed for scenes with dark foregrounds and the difference taken. (Right) The computed STA across 22 cells revealed antagonistic sub-regions
Acknowledgment: This work was partly supported by JSPS (KAKENHI, 26280047, 17H01754) and National Institutes of Health (R01EY027544 and R01DA040990).
Reference
- 1.Williford JR, Von Der Heydt R. Figure-ground organization in visual cortex for natural scenes. eNeuro 2016 Nov; 3(6) 1–15
O9 Development of periodic and salt-and-pepper orientation maps from a common retinal origin
Min Song, Jaeson Jang, Se-Bum Paik
Korea Advanced Institute of Science and Technology, Department of Biology and Brain Engineering, Daejeon, South Korea
Correspondence: Min Song (night@kaist.ac.kr)
BMC Neuroscience 2019, 20(Suppl 1):O9
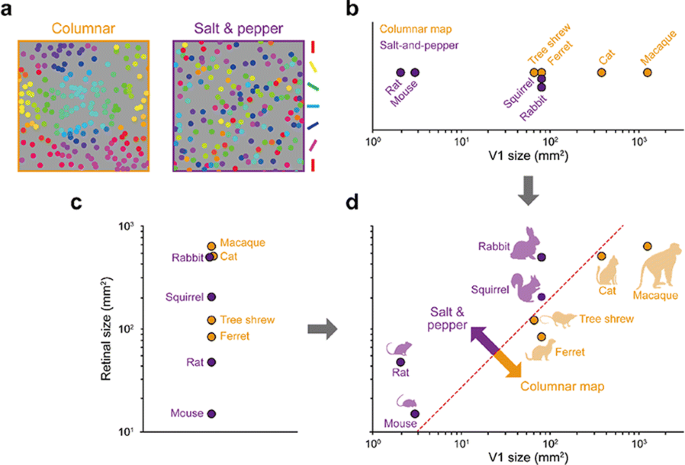
Spatial organization of orientation tuning in the primary visual cortex (V1) is arranged in different forms across mammalian species. In some species (e.g. monkeys or cats), the preferred orientation continuously changes across the cortical surface (columnar orientation map), while other species (e.g. mice or rats) have a random-like distribution of orientation preference, termed salt-and-pepper organization. However, it still remains unclear why the organization of the cortical circuit develops differently across species. Previously, it was suggested that each type of circuit might be a result of wiring optimization under different conditions of evolution [1], but the developmental mechanism of each organization of orientation tuning still remains unclear. In this study, we propose that the structural variations between cortical circuits across species simply arise from the differences in physical constraints of the visual system—the size of the retina and V1 (see Fig. 1). By expanding the statistical wiring model proposing that the orientation tuning of a V1 neuron is restricted by the local arrangement of ON and OFF retinal ganglion cells (RGCs) [2, 3], we suggest that the number of V1 neurons sampling a given RGC (sampling ratio) is a crucial factor in determining the continuity of orientation tuning in V1. Our simulation results show that as the sampling ratio increases, neighboring V1 neurons receive similar retinal inputs, resulting in continuous changes in orientation tuning. To validate our prediction, we estimated the sampling ratio of each species from the physical size of the retina and V1 [5] and compared with the organization of orientation tuning. As predicted, this ratio could successfully distinguish diverse mammalian species into two groups according to the organization of orientation tuning, even though the organization has not been clearly predicted by considering only a single factor in the visual system (e.g. V1 size or visual acuity; [4]). Our results suggest a common retinal origin of orientation preference across diverse mammalian species, while its spatial organization can vary depending on the physical constraints of the visual system.
References
- 1.Kaschube M. Neural maps versus salt-and-pepper organization in visual cortex. Current opinion in neurobiology 2014, 24: 95-102.
- 2.Ringach DL. “Haphazard wiring of simple receptive fields and orientation columns in visual cortex.” Journal of neurophysiology 2004, 92.1: 468-476.
- 3.Ringach DL. On the origin of the functional architecture of the cortex. PloS one 2007, 2.2: e251.
- 4.Van Hooser SD, et al. Orientation selectivity without orientation maps in visual cortex of a highly visual mammal. Journal of Neuroscience 2005, 25.1: 19-28.
- 5.Colonnese MT, et al. A conserved switch in sensory processing prepares developing neocortex for vision. Neuron 2010, 67.3: 480-498.
O10 Explaining the pitch of FM-sweeps with a predictive hierarchical model
Alejandro Tabas1, Katharina von Kriegstein2
1Max Planck Institute for Human Cognitive and Brain Sciences, Research Group in Neural Mechanisms of Human Communication, Leipzig, Germany; 2Tesnische Universität Dresden, Chair of Clinical and Cognitive Neuroscience, Faculty of Psychology, Dresden, Germany
Correspondence: Alejandro Tabas (alextabas@gmail.com)
BMC Neuroscience 2019, 20(Suppl 1):O10
Frequency modulation (FM) is a basic constituent of vocalisation. FM-sweeps in the frequency range and modulation rates of speech have been shown to elicit a pitch percept that consistently deviates from the sweep average frequency [1]. Here, we use this perceptual effect to inform a model characterising the neural encoding of FM.
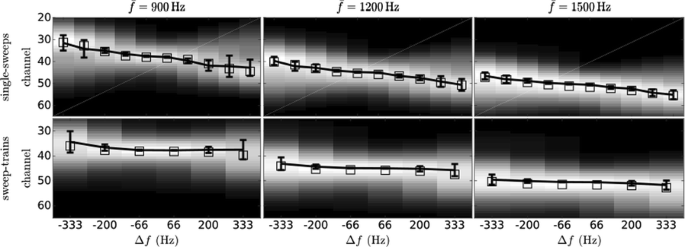
First, we performed a perceptual experiment where participants were asked to match the pitch of 30 sweeps with probe sinusoids of the same duration. The elicited pitch systematically deviated from the average frequency of the sweep by an amount that depended linearly on the modulation slope. Previous studies [2] have proposed that the deviance might be due to a fixed-sized-window integration process that fosters frequencies present at the end of the stimulus. To test this hypothesis, we conducted a second perceptual experiment considering the pitch elicited by continuous trains of five concatenated sweeps. As before, participants were asked to match the pitch of the sweep trains with probe sinusoids. Our results showed that the pitch deviance from the mean observed in sweeps was severely reduced in the train stimuli, in direct contradiction with the fixed-sized-integration-window hypothesis.
The perceptual effects may also stem from unexpected interactions between the frequencies spanned in the stimuli during pitch processing. We studied this posibility in two well-established families of mechanistic models of pitch. First, we considered a general spectral model that computes pitch as the expected value of the activity distribution across the cochlear decomposition. Due to adaptation effects, this model fostered the spectral range present at the beginning of the sweep: the exact opposite of what we observed in the experimental data. Second, we considered the predictions of the summary autocorrelation function (SACF) [3], a prototypical model of temporal pitch processing that considers the temporal structure of the auditory nerve activity. The SACF was unable to integrate temporal pitch information quickly enough to keep track of the modulation rate, yielding inconsistent pitch predictions that deviated stochastically from the average frequency.
Here, we introduce an alternative hypothesis based on top-down facilitation. Top-down efferents constitute an important fraction of the fibres in the auditory nerve; moreover, top-down predictive facilitation may reduce the metabolic cost and increase the speed of the neural encoding of expected inputs. Our model incorporates a second layer of neurons encoding FM direction that, after detecting that the incoming inputs are consistent with a rising (falling) sweep, anticipate that neurons encoding immediately higher (lower) frequencies will activate next. This prediction is propagated downwards to neurons encoding such frequencies, increasing their readiness and effectively inflating their weight during pitch temporal integration.
The described mechanism fully reproduces our and previously published experimental results (Fig. 1). We conclude that top-down predictive modulation plays an important role in the neural encoding of frequency modulation even at early stages of the processing hierarchy.
References
- 1.d’Alessandro C, Castellengo M. The pitch of short‐duration vibrato tones. The Journal of the Acoustical Society of America 1994 Mar;95(3):1617-30.
- 2.Brady PT, House AS, Stevens KN. Perception of sounds characterized by a rapidly changing resonant frequency. The Journal of the Acoustical Society of America 1961 Oct;33(10):1357-62.
- 3.Meddis R, O’Mard LP. Virtual pitch in a computational physiological model. The Journal of the Acoustical Society of America 2006 Dec;120(6):3861-9.
O11 Effects of anesthesia on coordinated neuronal activity and information processing in rat primary visual cortex
Heonsoo Lee, Shiyong Wang, Anthony Hudetz
University of Michigan, Anesthesiology, Ann Arbor, MI, United States of America
Correspondence: Heonsoo Lee (heonslee@umich.edu)
BMC Neuroscience 2019, 20(Suppl 1):O11
Introduction: Understanding of how anesthesia affects neural activity is important to reveal the mechanism of loss and recovery of consciousness. Despite numerous studies during the past decade, how anesthesia alters spiking activity of different types of neurons and information processing within an intact neural network is not fully understood. Based on prior in vitro studies we hypothesized that excitatory and inhibitory neurons in neocortex are differentially affected by anesthetic. We also predicted that individual neurons are constrained to population activity, leading to impaired information processing within a neural network.
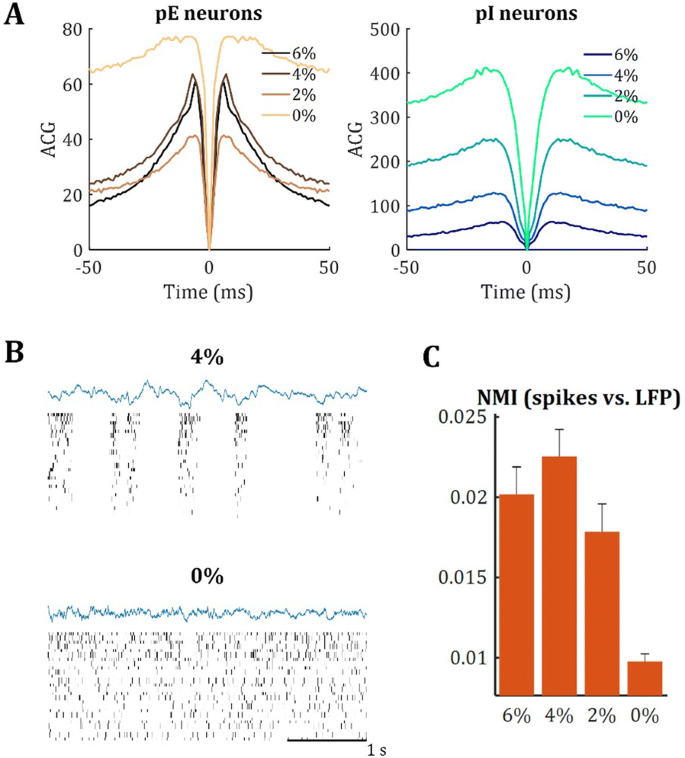
Methods: We implanted sixty-four-contact microelectrode arrays in primary visual cortex (layer 5/6, contacts spanning 800 µm depth and 1600 µm width) for recording of extracellular unit activity at three steady-state levels of anesthesia (6, 4 and 2% desflurane) and wakefulness (number of rats = 8). Single unit activities were extracted and putative excitatory and inhibitory neurons were identified based on their spike waveforms and autocorrelogram characteristics (number of neurons = 210). Neuronal features such as firing rate, interspike interval (ISI), bimodality, and monosynaptic spike transmission probabilities were investigated. Normalized mutual information and transfer entropy were also applied to investigate the interaction between spike trains and population activity (local field potential; LFP).
Results: First, anesthesia significantly altered characteristics of individual neurons. Firing rate of most neurons was reduced; this effect was more pronounced in inhibitory neurons. Excitatory neurons showed enhanced bursting activity (ISI<9 ms) and silent periods (hundreds of milliseconds) (Fig. 1A). Second, anesthesia disrupted information processing within a neural network. Neurons shared the silent periods, resulting in synchronous population activity (neural oscillations), despite of the suppressed monosynaptic connectivity (Fig. 1B). The population activity (LFP) showed reduced information content (entropy), and was easily predicted by individual neurons; that is, shared information between individual neurons and population activity was significantly increased (Fig. 1C). Transfer entropy analysis revealed a strong directional influence from LFP to individual neurons, suggesting that neuronal activity is constrained to the synchronous population activity.
Conclusions: This study reveals how excitatory and inhibitory neurons are differentially affected by anesthetic, leading to synchronous population activity and impaired information processing. These findings provide an integrated understanding of anesthetic effects on neuronal activity and information processing. Further study of stimulus evoked activity and computational modeling will provide a more detailed mechanism of how anesthesia alters neural activity and disrupts information processing.



No hay comentarios:
Publicar un comentario