P74 Graph theory-based representation of hippocampal dCA1 learning network dynamics
Giuseppe Pietro Gava1, Simon R Schultz2, David Dupret3
1Imperial College London, Biomedical Engineering, London, United Kingdom; 2Imperial College London, London, United Kingdom; 3University of Oxford, Medical Research Council Brain Network Dynamics Unit, Department of Pharmacology, Oxford, United Kingdom
Correspondence: Giuseppe Pietro Gava (giuseppepietrogava@gmail.com)
BMC Neuroscience 2019, 20(Suppl 1):P74
Since the discovery of place and grid cells, the hippocampus has been attributed a particular sensitivity to the spatial-contextual features of memory and learning. A crucial area in these processes is the dorsal CA1 hippocampus region (dCA1), where both pyramidal cells and interneurons are found. The former are excitatory cells that display tuning to spatial location (place fields), whilst the latter regulate the network with inhibitory inputs. Graph theory gives us powerful tools for studying such complex systems by representing, analyzing and modelling the dynamics of hundreds of components (neurons) interacting together. Graph theory-based methods are employed by network neuroscience to yield insightful descriptions of neural networks dynamics [1].
Here, we propose a graph theory-based analysis of the dCA1 network, recorded from mice engaged in a condition place preference task. In this protocol the animals first explore a familiar environment (fam). Afterwards, it is introduced to two novel arenas (pre/post), which are later individually associated with different reward dispensers. We analyse electro-physiological data from 2 animals, 7 recording days combined, for a total of 617 putative pyramidal cells and 38 putative interneurons. To investigate the dynamics of the recorded network, we apply directed weighted graphs using a directional biophysically-inspired measure of the functional connectivity between each neuron.
As of now, we have limited our analysis to the dynamics of putative pyramidal cells in the network. As the task progresses and the animal learns the reward associations, we observe an overall increase in the average strength (S) of the network (S_pre = 0.41±0.08 / S_post = 0.78±0.09, mean ± s.e.m. normalized units). The average firing rate (FR), instead, peaks only during the first exploration of the novel environment and decreases thereafter—(FR_fam = 0.78±0.02 / FR_pre = 0.95±0.02 / FR_post = 0.82±0.02). Together with S, an overall decrease in the shortest path length (PL) in the network suggests that the system shifts towards a more small-world structure (PL_fam = 1±0 / PL_pre = 0.76±0.09 / PL_post = 0.61±0.10). This topology has been described to be more adaptive and efficient, thus fit to encode new information [2]. The evolution of the network during learning is also indicated by its Riemannian distance from the activity patterns evoked in fam. This measure increases from the exposition to pre (0.88±0.02) to the end of learning (0.98±0.01), decreases in post (0.91±0.02) and is at its minimum when fam is recalled (0.78±0.06). These results suggest that the evoked patterns in pre and post are similar, as they represent the same environment, even if they display different network activity measures (S, FR, PL). We hypothesize that these metrics might indicate the learning-related dynamics that favor the encoding of new information.
We are to integrate these findings with information measures at the individual neuron level. The finer structure of the network may be investigated: from changes in pyramidal cells’ spatial tuning, to diverse regulatory action of the interneuron population. Together, these analyses will provide us with an insightful picture of the dCA1 network dynamics during learning.
References
- 1.Bassett DS, Sporns O. Network neuroscience. Nature neuroscience 2017 Mar;20(3):353.
- 2.Bassett DS, Bullmore ED. Small-world brain networks. The neuroscientist 2006 Dec;12(6):512–23.
P75 Measurement-oriented deep-learning workflow for improved segmentation of myelin and axons in high-resolution images of human cerebral white matter
Predrag Janjic1, Kristijan Petrovski1, Blagoja Dolgoski2, John Smiley3, Panče Zdravkovski2, Goran Pavlovski4, Zlatko Jakjovski4, Natasa Davceva4, Verica Poposka4, Aleksandar Stankov4, Gorazd Rosoklija5, Gordana Petrushevska2, Ljupco Kocarev6, Andrew Dwork5
1Macedonian Academy of Sciences and Arts, Research Centre for Computer Science and Information Technologies, Skopje, Macedonia; 2School of Medicine, Ss. Cyril and Methodius University Skopje, Institute of Pathology, Skopje, Macedonia; 3Nathan S. Kline Institute for Psychiatric Research, New York, United States of America; 4School of Medicine, Ss. Cyril and Methodius University, Institute of Forensic Medicine, Skopje, Macedonia; 5New York State Psychiatric Institute, Columbia University, Division of Molecular Imaging and Neuropathology, New York, United States of America; 6Macedonian Academy of Sciences and Arts, Skopje, Macedonia
Correspondence: Predrag Janjic (predrag.a.janjic@gmail.com)
BMC Neuroscience 2019, 20(Suppl 1):P75
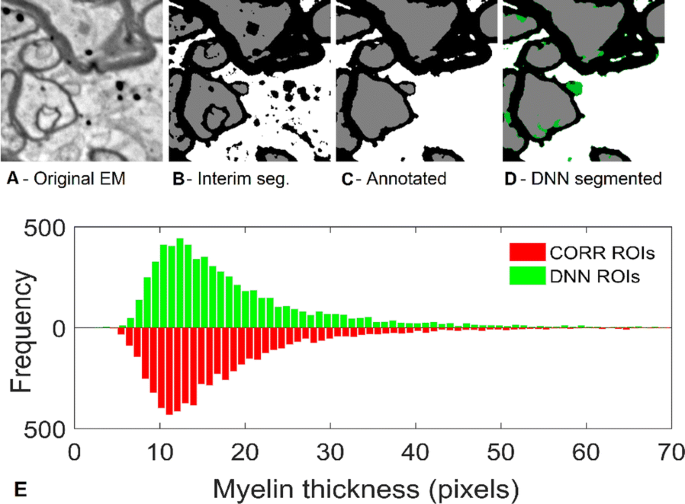
Background: In CNS, the relationship between axon diameter and myelin thickness is more complex than in peripheral nerve. Standard segmentation of high-contrast electron micrographs (EM) segments the myelin accurately, but even in studies of regular, parallel fibers, this does not translate easily into measurements of individual axons and their myelin sheaths, Quantitative morphology of myelinated axons requires measuring the diameters of thousands of axons and the thickness of each axon’s myelin sheath. We describe here a procedure for automated refinement of segmentation and measurement of each myelinated axon and its sheath in EMs (11 nm/pixel) of arbitrarily oriented prefrontal white matter (WM) from human autopsies (Fig. 1A).
(Upper) a Fragment of original EM image has gone through automated pre-segmentation and automated post-processing producing Interim image b used as DNN input. c Fully corrected and annotated version used as “ground truth”. d DNN segmented fragment, with green pixels marking pixel errors compared to c. (lower) Histogram of myelin thickness measurements of a same dataset
New methods: Preliminary segmentation of myelin, axons and background in the original images, using ML techniques based on manually selected filters (Fig. 1B), are postprocessed for correcting of typical, systematic errors in the preliminary-segmentation. Final, refined and corrected segmentation is achieved by deep neural networks (DNN) which classify the central pixel of an input fragment (Fig. 1D). We use two DNN architectures: (i) Denoising auto-encoder using convolutional neural network (CNN) layers for initialization of weights to the first receptive layer of the main DNN, which is built in (ii) classical multilayer CNN architecture Automated routine gives radial measurements of each putative axon and its myelin sheath, after it rejects measures encountering predefined artifacts and excludes fibers that fail to satisfy certain predefined conditions. The ML processing, after a working dataset of 30 images, 2048x2048 pixel is preprocessed, takes ~ 1h 40min. for complete pixel-based segmentation of ~ 8,000 ÷ 9,000 fiber ROIs per set, on a commercial PC equipped with a single GTX-1080 class GPU.
Results: This routine improved segmentation of three sets of 30 annotated images (sets 1 and 2 from prefrontal white matter, while set 3 was from optic nerve), with DNN trained only with a subset of set 1 images. Total number of myelinated axons identified by the DNN differed from the human segmentation by 0.2%, 2.9%, and − 5.1% for sets 1–3, respectively. G-ratios differed by 2.96%, 0.74% and 2.83%. Myelin thickness measurements were even closer, Fig. 1E. Intraclass correlation coefficients between DNN and annotated segmentation, were mostly>0.9, indicating nearly interchangeable performance.
Comparison with existing method(s): Measurement-oriented studies of arbitrarily oriented fibers (appearing in single images) from human frontal white matter are rare. Published studies of spinal cord white matter or peripheral nerve typically measure aggregated area of myelin sheaths, allowing only an aggregate estimation of average g-ratio, assuming counterfactually that g-ratio is the same for all fibers. Thus, our method fulfills an important need.
Conclusions: Automated segmentation and measurement of axons and myelin is more complex than it appears initially. We have developed a feasible approach that has proven comparable to human segmentation in our tests so far, and the trained networks generalize very well on datasets other than those used in training.
Acknowledgements: This work has been funded by National Institutes of Health, NIMH under MH98786.
P76 Spike latency reduction generates efficient encoding of predictions
Pau Vilimelis Aceituno1, Juergen Jost2, Masud Ehsani1
1Max Planck Institute for Mathematics in the Sciences, Cognitive group of Juergen Jost, Leipzig, Germany; 2Max Planck Institute for Mathematics in the Sciences, Leipzig, Germany
Correspondence: Pau Vilimelis Aceituno (pau.aceituno@mis.mpg.de)
BMC Neuroscience 2019, 20(Suppl 1):P76
Living organisms make predictions in order to survive, posing the question of how do brains learn to make those predictions. General models based on classical conditioning [1] assume that prediction performance is feed back into the predicting neural population. However, recent studies have found that sensory neurons without feedback from higher brain areas encode predictive information [4]. Therefore, a bottom-up process without explicit feedback should also generate predictions. Here we present such a mechanism through latency reduction, an effect of Synaptic Time-Dependent Plasticity (STDP) [3].
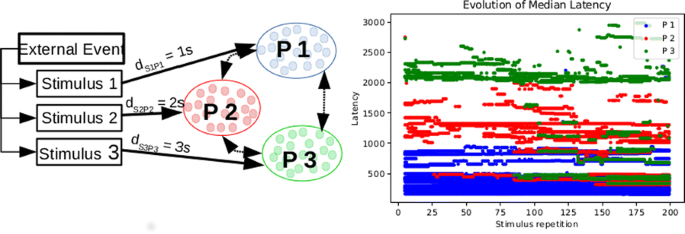
We study leaky-integrate and fire neurons with a refractory period (LIF), each one getting a fixed input spike train that is repeated many times. The weights of the synapses change following the Synaptic Time-Dependent Plasticity (STDP) with soft bounds. From this we use a variety of mathematical tools and simulations to create the following argument:
- Short Temporal Effects: We analyze how do postsynaptic spikes evolve, showing that a single postsynaptic spike reduces its latency
- Long Temporal Effects: We prove that the postsynaptic spike train becomes very dense at input onset and that the number of postsynaptic spikes reduces with the stimulus repetition.
- Coding: The concentration of inputs makes the code more efficient in metabolic and decoding terms.
- Predictions: STDP makes postsynaptic neurons fire at the onset of the input spike train, which might be before the stimulus if the input spike train includes a pre-stimulus clue, thus generating predictions.
We show here (Fig. 1) that STDP in combination with regularly timed presynaptic spikes generates postsynaptic codes that are efficient and explain how forecasting are phenomena that emerge in an unsupervised way with a simple mechanistic interpretation. We believe that this idea offers an interesting complement to classical supervised predictive coding schemes in which prediction errors are feed back into the coding neurons. Furthermore, the concentration of postsynaptic spikes at stimulus onset can be interpreted in information theoretical terms as a way to improve the code in terms of error-resilience. Finally, we speculate that the fact that the same mechanism can be used to generate predictions as well as improve the effectiveness and metabolic efficiency of the neural code might give insights into how the ability of the nervous system to forecast might have evolved.
References
- 1.Dayan P, Abbott LF. Theoretical neuroscience: computational and mathematical modeling of neural systems. MIT Press 2001.
- 2.Song S, Miller KD, Abbott LF. Competitive Hebbian learning through spike-timing-dependent synaptic plasticity. Nature neuroscience 2000 Sep;3(9):919.
- 3.Guyonneau R, VanRullen R, Thorpe SJ. Neurons tune to the earliest spikes through STDP. Neural Computation 2005 Apr 1;17(4):859–79.
- 4.Palmer SE, Marre O, Berry MJ, Bialek W. Predictive information in a sensory population. Proceedings of the National Academy of Sciences 2015 Jun 2;112(22):6908–13.
P77 Differential diffusion in a normal and a multiple sclerosis lesioned connectome with building blocks of the peripheral and central nervous system
Oliver Schmitt1, Christian Nitzsche1, Frauke Ruß1, Lena Kuch1, Peter Eipert1
1University of Rostock, Department of Anatomy, Rostock, Germany
Correspondence: Oliver Schmitt (schmitt@med.uni-rostock.de)
BMC Neuroscience 2019, 20(Suppl 1):P77
The structural connectome (SC) of the rat nervous system has been built by collating neuronal connectivity information from tract tracing publications [1]. In most publications semi quantitative estimates of axonal densities are indicated. These connectivity weights and the orientation of connections (source-target of action potentials) were imported into neuroVIISAS [2].
The connectivity of the peripheral nervous system and of the spinal cord allows a continuous reconstruction of the transfer of afferent signals from the periphery, respectively, dorsal root ganglions via intraspinal or medullary secondary neurons. As opposed to this the efferent pathway from the central peripheral nervous system (PNS) through primary vegetative neurons as well as α-motoneurons is available, too. This thorough connectome data allows the investigation of complete peripheral-central-afferents pathways as well as central-peripheral-efferent pathways by dynamic analyses.
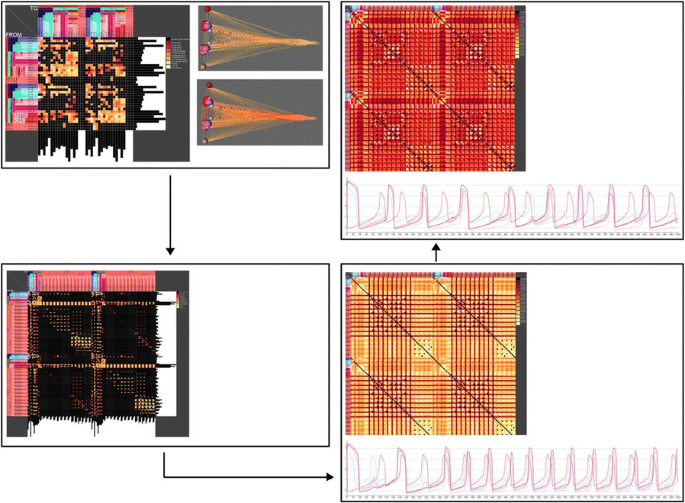
The propagation of signals derived from basic diffusion processes [3], the Gierer-Meinhardt [4] and Mimura-Murray [5] diffusion models (DM) was investigated. The models have been adapted to a weighted and directed connectome. The application of DM in SCs exhibit a lower complexity by contrast with coupled single neuron models (FitzHugh Nagumo (FHN)) [3] or models of spiking LIF populations. To compare outcomes of DM the FHN model has been realized in the same SC (Fig. 1).
Visualization of bilateral weighted connectivity (upper left: adjacency matrix) of spinal and supraspinal regions (spherical 3D reconstruction). Upper right: Coactivation matrix of an FHN simulation. FHN oscillations of an afferent pathway. Lower left: Adjacency matrix of complete bilateral system. Coactivation matrix after simulating a MS demyelination
Modeling of diseases like Alzheimer and Parkinson as well as multiple sclerosis (MS) in SC helps to understand spreading of pathology and predicting changes of white and gray matter [6-8]. The reduction of connection weights by modelling reflect the effect of myelin degeneration in MS. The change [9] of diffusibility of a lesioned afferent-efferent loop in the rat PNS-ZNS has been analyzed. A reduction of diffusion was observed in the GM and MM models following linear and nonlinear reduction of connectivity weights of central processes of the dorsal root ganglion neurons, cuneate and gracile nuclei. The change of diffusibility shows slight effects in the motoric pathway.
The effects of the two models coincides with clinical observations with regard to paresthesias and spaticity because changes of diffusion were most prominent in the somatosensory and somatomotoric system. Further investigations will be performed to analyze functional effects of local white matter lesions as well as long term functional changes.
References
- 1.Schmitt O, Eipert P, Kettlitz R, Leßmann F, Wree A. The connectome of the basal ganglia. Brain Structure and Function 2016 Mar 1;221(2):753–814.
- 2.Schmitt O, Eipert P. neuroVIISAS: approaching multiscale simulation of the rat connectome. Neuroinformatics 2012 Jul 1;10(3):243–67.
- 3.Messé A, Hütt MT, König P, Hilgetag CC. A closer look at the apparent correlation of structural and functional connectivity in excitable neural networks. Scientific reports 2015 Jan 19;5:7870.
- 4.Gierer A, Meinhardt H. A theory of biological pattern formation. Kybernetik 1972 Dec 1;12(1):30–9.
- 5.Nakao H, Mikhailov AS. Turing patterns in network-organized activator–inhibitor systems. Nature Physics 2010 Jul;6(7):544.
- 6.Ji GJ, Ren C, Li Y, Sun J, et al. Regional and network properties of white matter function in Parkinson’s disease. Human brain mapping 2019 Mar;40(4):1253–63.
- 7.Ye C, Mori S, Chan P, Ma T. Connectome-wide network analysis of white matter connectivity in Alzheimer’s disease. NeuroImage: Clinical 2019 Jan 1;22:101690.
- 8.Mangeat G, Badji A, Ouellette R, et al. Changes in structural network are associated with cortical demyelination in early multiple sclerosis. Human brain mapping 2018 May;39(5):2133–46.
- 9.Schwanke S, Jenssen J, Eipert P, Schmitt O. Towards Differential Connectomics with NeuroVIISAS. Neuroinformatics 2019 Jan 1;17(1):163–79.
P78 Linking noise correlations to spatiotemporal population dynamics and network structure
Yanliang Shi1, Nicholas Steinmetz2, Tirin Moore3, Kwabena Boahen4, Tatiana Engel1
1Cold Spring Harbor Laboratory, Cold Spring Harbor, NY, United States of America; 2University of Washington, Department of Biological Structure, Seattle, United States of America; 3Stanford University, Department of Neurobiology, Stanford, California, United States of America; 4Stanford University, Departments of Bioengineering and Electrical Engineering, Stanford, United States of America
Correspondence: Yanliang Shi (shi@cshl.edu)
BMC Neuroscience 2019, 20(Suppl 1):P78
Neocortical activity fluctuates endogenously, with much variability shared among neurons. These co-fluctuations are generally characterized as correlations between pairs of neurons, termed noise correlations. Noise correlations depend on anatomical dimensions, such as cortical layer and lateral distance, and they are also dynamically influenced by behavioral states, in particular, during spatial attention. Specifically, recordings from laterally separated neurons in superficial layers find a robust reduction of noise correlations during attention [1]. On the other hand, recordings from neurons in different layers of the same column find that changes of noise correlations differ across layers and overall are small compared to lateral noise-correlation changes [2]. Evidently, these varying patterns of noise correlations echo the wide-scale population activity, but the dynamics of population-wide fluctuations and their relationship to the underlying circuitry remain unknown.
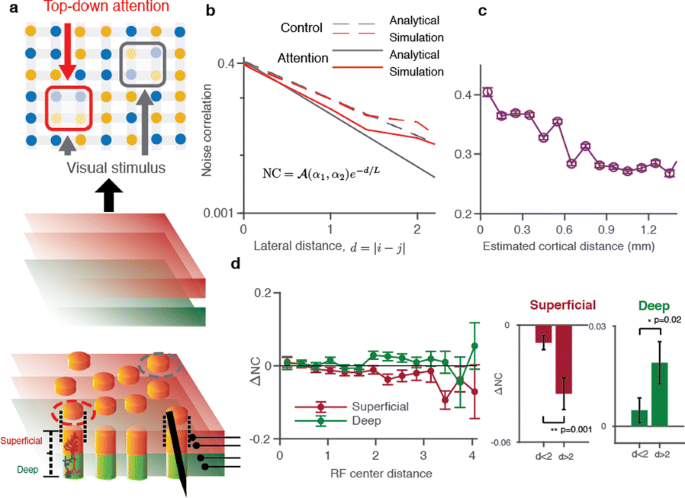
Here we present a theory which relates noise correlations to spatiotemporal dynamics of population activity and the network structure. The theory integrates vast data on noise correlations with our recent discovery that population activity in single columns spontaneously transitions between synchronous phases of vigorous (On) and faint (Off) spiking [3]. We develop a network model of cortical columns, which replicates cortical On-Off dynamics. Each unit in the network represents one layer—superficial or deep—of a single column (Fig. 1a). Units are connected laterally to their neighbors within the same layer, which correlates On-Off dynamics across columns. Visual stimuli and attention are modeled as external inputs to local groups of units. We study the model by simulations and also derive analytical expressions for distance-dependent noise correlations. To test the theory, we analyze linear microelectrode array recordings of spiking activity from all layers of the primate area V4 during an attention task.
a Model architecture. A network of columns with lateral interactions represents one layer of cortical area V4. b The theory predicts that noise correlations decay exponentially with lateral distance. c Decrease of noise correlations with lateral distance in the laminar recordings. d Recordings show that during attention, noise correlations decrease in superficial and increase in deep layers
First, at the scale of single columns, the theory accurately predicts the broad distribution of attention-related changes of noise-correlations in our laminar recordings, indicating that they largely arise from the On-Off dynamics. Second, the network model mechanistically explains differences in attention-related changes of noise-correlations at different lateral distances. Due to spatial connectivity, noise correlations decay exponentially with lateral distance, characterized by the decay-constant called correlation length (Fig. 1b) . Correlation length depends on the strength of lateral connections, but it is also modulated by attentional inputs, which effectively regulate the relative influence of lateral inputs. Thus changes of lateral noise-correlations mainly arise from changes in the correlation length. The model predicts that at intermediate lateral distances (<1mm), noise-correlation changes decrease or increase with distance, when the correlation-length increases or decreases, respectively. To test these predictions, we used distances between receptive-field centers to estimate lateral shifts in our laminar recordings (Fig. 1c). We found that during attention, correlation length decreases in superficial and increases in deep layers, indicating differential modulation of superficial and deep layers. (Fig. 1d). Our work provides a unifying framework that links network mechanisms shaping noise correlations to dynamics of population activity and underlying cortical circuit structure.
References
- 1.Cohen MR, Maunsell JH. Attention improves performance primarily by reducing interneuronal correlations. Nature neuroscience 2009 Dec;12(12):1594.
- 2.Nandy AS, Nassi JJ, Reynolds JH. Laminar organization of attentional modulation in macaque visual area V4. Neuron 2017 Jan 4;93(1):235–46.
- 3.Engel TA, Steinmetz NA, Gieselmann MA, Thiele A, Moore T, Boahen K. Selective modulation of cortical state during spatial attention. Science 2016 Dec 2;3.
P79 Modeling the link between optimal characteristics of saccades and cerebellar plasticity
Hari Kalidindi1, Lorenzo Vannucci1, Cecilia Laschi1, Egidio Falotico1
1Scuola Superiore Sant’Anna Pisa, The BioRobotics Institute, Pontedera, Italy
Correspondence: Hari Kalidindi (h.kalidindi@santannapisa.it)
BMC Neuroscience 2019, 20(Suppl 1):P79
Plasticity in cerebellar synapses is important for adaptability and fine tuning of fast reaching movements. The perceived sensory errors between the desired and actual movement outcomes are commonly considered to induce plasticity in the cerebellar synapses, with an objective to improve the desirability of the executed movements. In fast goal-directed eye movements called saccades, the desired outcome is to reach a given target location in minimum-time, with accuracy. However, an explicit encoding of this desired outcome is not observed in the cerebellar inputs prior to the movement initiation. It is unclear how the cerebellum is able to process only partial error information, that is the final reaching error signal obtained from sensors, to control both the reaching time as well as the precision of fast movements in an adaptive manner. We model the bidirectional plasticity at the parallel fiber to Purkinje cell synapses that can account for the mentioned saccade characteristics. We provide a mathematical and robot experimental demonstration of how the equations governing the cerebellar plasticity are determined by the desirability of the behavior. In the experimental results, the model output activity displays a definite encoding of eye speed and displacement during the movement. This is in line with the corresponding neurophysiological recordings of Purkinje cell populations in the cerebellar vermis of rhesus monkeys. The proposed modeling strategy, due to its mechanistic form, is suitable for studying the link between motor learning rules observed in biological systems and their respective behavioral principles.
P80 Attractors and flows in the neural dynamics of movement control
Paolo Del Giudice1, Gabriel Baglietto2, Stefano Ferraina3
1Istituto Superiore di Sanità, Rome, Italy; 2IFLYSIB Instituto de Fisica de Liquidos y Sistemas Biologicos (UNLP-CONICET), La Plata, Argentina; 3Sapienza University, Dept Physiology and Pharmacology, Rome, Italy
Correspondence: Paolo Del Giudice (paolo.delgiudice@iss.it)
BMC Neuroscience 2019, 20(Suppl 1):P80
Density-based clustering (DBC) [1] provides efficient representations of a multidimensional time series, allowing to cast it in the form of the symbolic sequence of the labels identifying the cluster to which each vector of instantaneous values belong. Such representation naturally lends itself to obtain compact descriptions of data from multichannel electrophysiological recordings.
We used DBC to analyze the spatio-temporal dynamics of dorsal premotor cortex in neuronal data recorded from two monkeys during a ‘countermanding’ reaching task: the animal must perform a reaching movement to a target on a screen (‘no-stop trials’), unless an intervening stop signal prescribes to withhold the movement (‘stop-trials’); no-stop (~70%) and stop trials (~30%) were randomly intermixed, and the stop signal occurred at variable times within the reaction time.
Multi-unit activity (MUA) was extracted from signals recorded using a 96-electrodes array. Performing DBC on the 96-dimensional MUA time series, we derived the corresponding discrete sequence of clusters’ centroid.
Through the joint analysis of such cluster sequences for no-stop and stop trials we show that reproducible cluster sequences are associated with the completion of the motor plan in no-stop trials, and that in stop trials the performance depends on the relative timing of such states and the arrival of the Stop signal.
Besides, we show that a simple classifier can reliably predict the outcome of stop trials from the cluster sequence preceding the appearance of the stop signal, at the single-trial level.
We also observe that, consistently with previous studies, the inter-trial variability of MUA configurations typically collapses around the movement time, and has minima corresponding to other behavioral events (Go signal; Reward); comparing the time profile of MUA inter-trial variability with the cluster sequences, we are led to ask whether the neural dynamics underlying the clusters sequence can be interpreted as attractor hopping. For this purpose we analyze the flow in the MUA configuration space: for each trial, and each time, the measured MUA values identify a point in the 96-dimensional space, such that each trial corresponds to a trajectory in this space, and a set of repeated trials to a bundle of trajectories, of which we can compute individual or average properties. We measure quantities suited to discriminate between a dynamics of convergence of the trajectories to a point attractor, from different flows in the MUA configuration space. We tentatively conclude that convergent attractor relaxation dynamics (in attentive wait conditions, as before the Go or the Reward events) coexist with coherent flows (associated with movement onset), in which low inter-trial variability of MUA configurations corresponds to a collapse in the directions of velocities (with high magnitude of the latter), like the system entering a funnel.
The ‘delay task’ (Go signal comes with a variable delay after the visual target), allows to further check our interpretation of specific MUA configurations (clusters) as being associated with the completion of the motor plan. Preliminary analysis shows that pre-movement-related MUA cluster sequences during delay trials are consistent with those from other trial types, though their time course qualitatively differs in the two monkeys, possibly reflecting different computational options.
Reference
- 1.Baglietto G, Gigante G, Del Giudice P. Density-based clustering: A ‘landscape view’ of multi-channel neural data for inference and dynamic complexity analysis. PloS one 2017 Apr 3;12(4):e0174918.


No hay comentarios:
Publicar un comentario